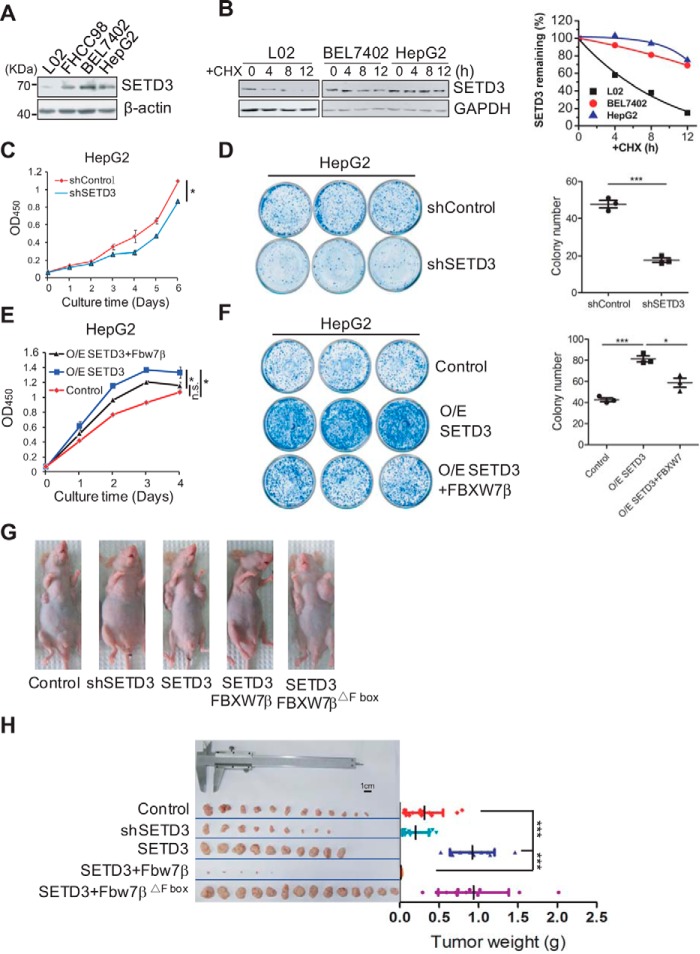
Figure 5.
SETD3 promotes cellular proliferation and tumorigenesis in liver cancer cells. A, relative SETD3 protein levels in various liver cell lines were examined by Western blotting with β-actin as a loading control. B, SETD3 protein stability in the indicated liver cell lines treated with CHX was examined by Western blotting (left panel), and relative SETD3 protein levels were plotted (right panel). C–F, cellular proliferation and colony formation assays were performed in the indicated HepG2 cell lines of either knockdown SETD3 by shRNA (C and D) or overexpression of SETD3 and FBXW7β (E and F). Cell growth curves were plotted over several consecutive days in C and E. Colony formation assays using the indicated cell lines were performed in D and F. Quantifications of colony numbers from the representative images (3 × 3 cm) from three independent plates are shown in D and F (right panel). G and H, SETD3 and FBXW7β regulate tumorigenicity of the liver cancer cells in nude mice. Images show tumor formation in nude mice (G) and the dissected tumors 27 days after injection (H). Tumor masses for each group are shown. Data are presented as mean ± S.E. *, p < 0.05; ***, p < 0.001, n.s., not significant.

