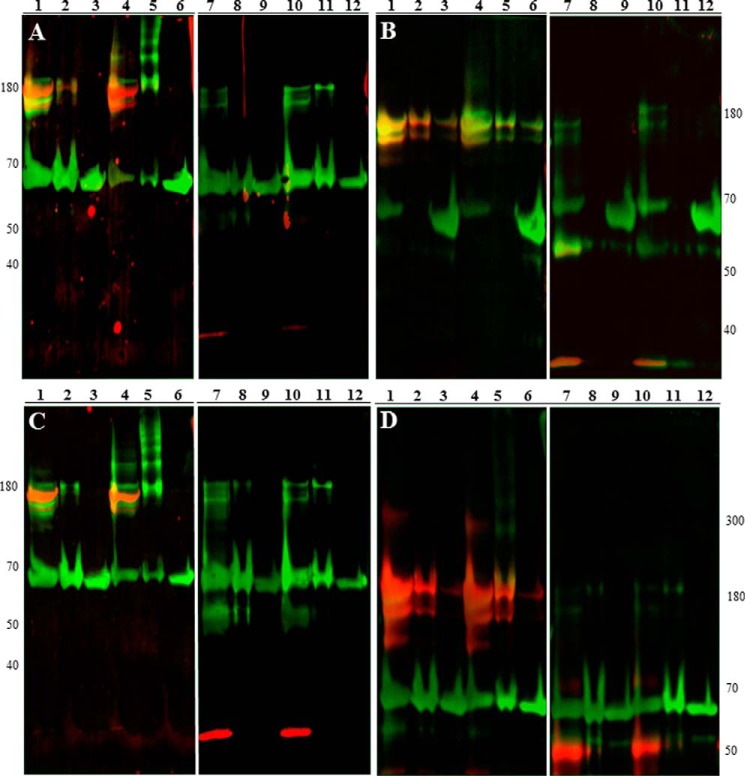
Figure 7.
Immunoblotting confirms complexed substrates identified via mass spectrometry. Platelet lysates and releasates were prepared as described. Samples were then immunoprecipitated with anti-FLAG antibody, purposely overloaded to detect PDI-substrate complexes, and separated by SDS-PAGE under either non-reducing (lanes 1–6) or reducing (lanes 7–12) conditions followed by immunoblotting onto PVDF membranes. Samples were visualized using both primary anti-FLAG antibody and primary antibody to either cathepsin G (A), heparanase (B), glutaredoxin-1 (C), or fibrin (D). Anti-FLAG signal is shown in green, target protein signal is displayed in red, and co-localization is displayed in yellow. The catalytically inactive AGHA variant was used as a control. Lanes 1 and 7, prereduced CGPC-PDI; lanes 2 and 8, prereduced CGRC-PDI; lanes 3 and 9, prereduced AGHA-PDI; lanes 4 and 10, preoxidized CGPC-PDI; lanes 5 and 11, preoxidized CGRC-PDI; lanes 6 and 12, preoxidized AGHA-PDI.

