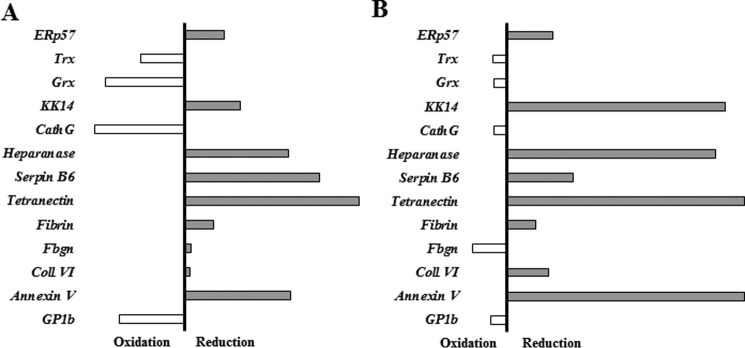
Figure 8.
The bias of the CGPC and CGRC PDI variants for forming complexes in their prereduced or preoxidized state. Shown is a graphical representation of the ratio of densitometry quantification of the target proteins identified for the CGPC variant (A) or the CGRC variant (B) in the prereduced or preoxidized samples. First, a target protein:PDI ratio was generated using the band intensities of both proteins from the oxidized or reduced samples (target:PDI variant). Then, a reduced:oxidized bias was generated using those values. Target proteins whose bias was toward the preoxidized state are oriented toward the left, and target proteins whose bias was toward the prereduced state are oriented toward the right. The black vertical bar represents the point of no bias, and the length of the bar represents the strength of the bias. Cath, cathepsin; Coll, collagen; Grx, glutaredoxin; Trx, thioredoxin; Fbgn, fibrinogen; KK, kallekrein.

