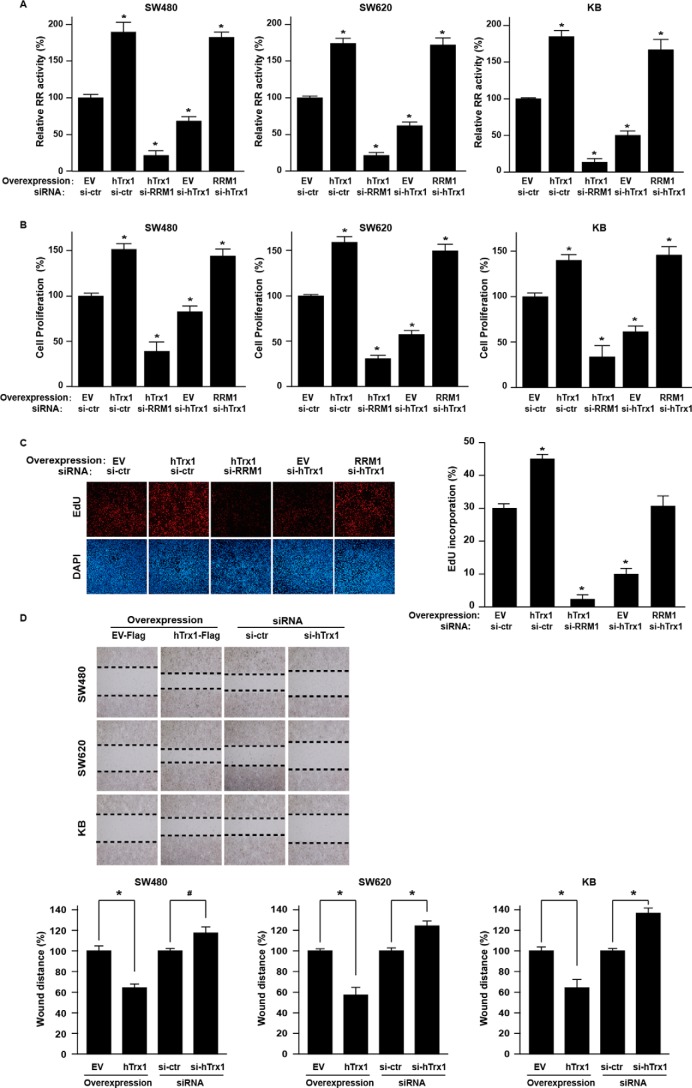
Figure 2.
hTrx1 increased RR activity by RRM1 regulation, which promoted malignant phenotypes in CRC cells. A, the RR activity of cell lysates was measured by RR activity assay (using DTT as a reductant as indicated in supplemental Table S1) in KB and CRC cells after the indicated transfection. RR activity = [3H]dCDP/([3H]CDP + [3H]dCDP) × 100%. Relative RR activity (y axis) is the RR activity of treatment group/control group × 100%. B, cell proliferation was measured by Cell Counting Kit-8 assay in KB and CRC cells after the indicated transfection. The y axis is cell viability of treatment group/control group × 100%. The data shown represent the mean ± S.D. (n = 3). *, p < 0.01, treatment group versus control group. C, the DNA synthesis was measured by EdU assay in SW480 cells after the indicated transfection. On the left is the live staining, and on the right is the quantitation. The data shown represent the mean ± S.D. (n = 3). *, p < 0.01, treatment group versus control group. D, cell migration was measured by wound healing assay in KB and CRC cells after the indicated transfection. At the top is the live staining, and on the bottom is the quantitation. Bottom panel, the y axis is wound distance of EV group/hTrx1 group × 100% or si-control (si-ctr) group/si-hTrx1 group × 100%. The data shown represent the mean ± S.D. (n = 3). *, p < 0.01; #, p < 0.05, EV group versus hTrx1 group, si-control group versus si-hTrx1. Error bars represent S.D.

