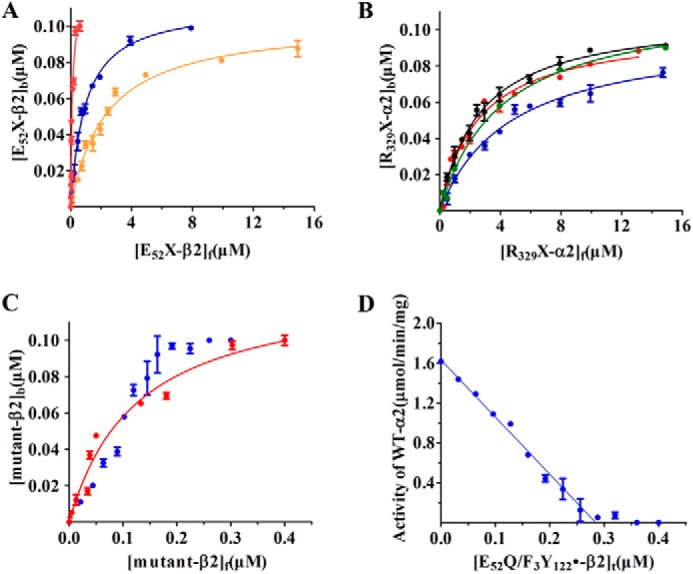
Figure 2.

Kd between α2 and β2 in the presence of CDP/ATP determined by the competitive inhibition spectrophotometric assay (12). The data were fit (solid line) to Equation 1. All data are representative of two independent experiments and are expressed as mean ± S.D. Subscript b, f, and t are the bound, free, and total protein concentrations, respectively. A, Kd for α2/E52X-β2 (X = Ala, Asp, or Gln). E52A (blue), E52D (orange), E52Q (red) are shown. B, Kd for mutant-α2/β2: R329A (blue), R329K (red), R329Q (black), and R639Q (green). C, binding for α2/E52Q/F3Y122•-β2 shows a stoichiometric titration under standard assay conditions (blue) and an expanded version of α2/E52Q-β2 shown in A (red). D, analysis of activity with increasing concentrations of E52Q/F3Y122• (0.7 F3Y122•, see text).
