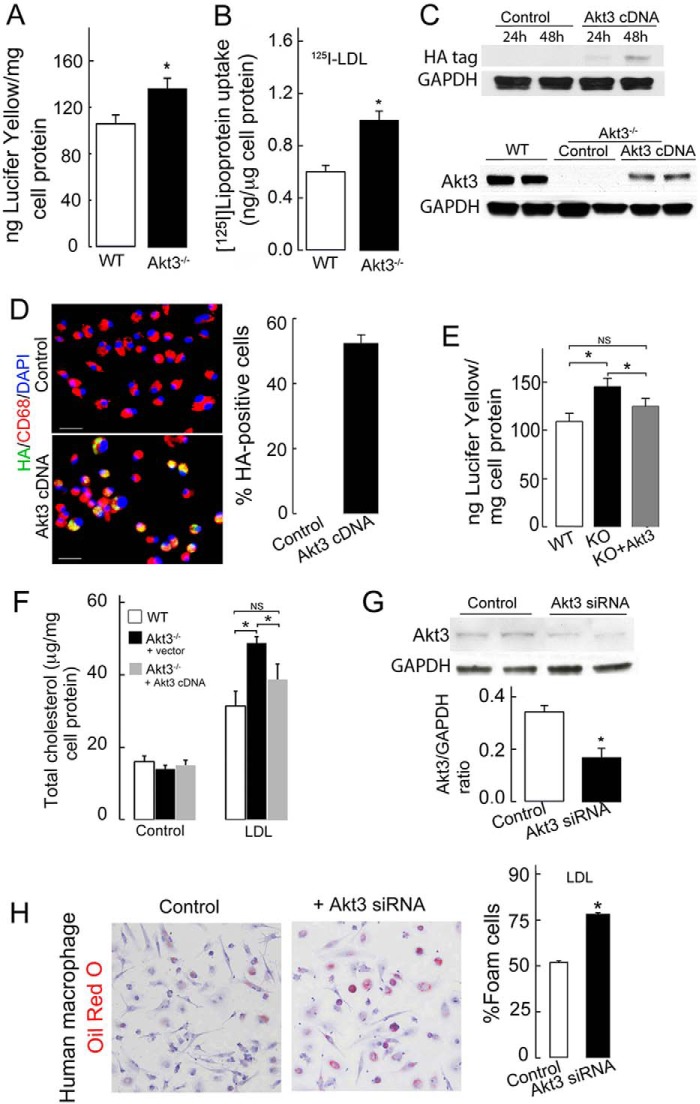
Figure 1.
Suppression of Akt3 expression in murine and human macrophages promotes pinocytosis. A, uptake of Lucifer yellow dye by WT and Akt3−/− MPMs. Wild-type or Akt3−/− MPMs were cultured in RPMI 1640/10% FBS medium containing 0.5 mg/ml Lucifer yellow dye at 4 °C or at 37 °C for 2 h. Cells were washed, lysed by Triton X-100, and Lucifer yellow was quantified by spectrofluorometry (n = 6). B, uptake of 125I-LDL by WT and Akt3−/− MPMs. MPMs from WT and Akt3−/− mice were incubated for 8 h at 37 °C with 100 μg/ml of 125I-labeled native LDL, and uptake of 125I-lipoprotein was quantified (n = 5). C, expression of the HA tag (top panel) or Akt3 (bottom panel) in WT or Akt3−/− MPMs transfected with a control plasmid or a plasmid containing Akt3 cDNA (top panel) (n = 3). D, Akt3−/− MPMs were stained with antibodies against the HA tag (green), the macrophage marker CD68 (red), and with DAPI (blue) after transfection with control vector or plasmid containing Akt3 cDNA for 48 h (n = 8). Scale bars = 25 μm. The transfection efficiency was determined by the percentage of HA-positive macrophages. E, uptake of Lucifer yellow dye was assessed in WT MPM, Akt3−/− MPM (KO), and Akt3−/− MPMs transfected with Akt3 cDNA (KO+Akt3) for 48 h (n = 9). F, Akt3−/− MPM were transfected with control vector or Akt3 cDNA expression vector for 48 h. WT and transfected Akt3−/− MPMs were incubated without (control) or with 0.1 mg/ml of LDL for 24 h. Total cellular cholesterol was quantified using a Biovision Cholesterol/CE Quantitation Kit II (n = 8). G, Akt3 expression in human MDMs treated with control siRNA or Akt3 siRNA was assessed by Western blot analysis using rabbit anti-Akt3 and mouse anti-GAPDH antibodies (n = 6). H, foam cell formation assay of human MDMs treated with Akt3 siRNA and then cultured in the presence of 0.1 mg/ml native LDL for 48 h. Cells were fixed with 4% formaldehyde, stained with oil red O, and counterstained with hematoxylin. Quantification of macrophage foam cells was done as the percentage of the total number of cells (n = 6). Data represent means ± S.E. *, p < 0.05; NS, p > 0.05. Data are representative of at least three independent experiments.

