
Figure 1.
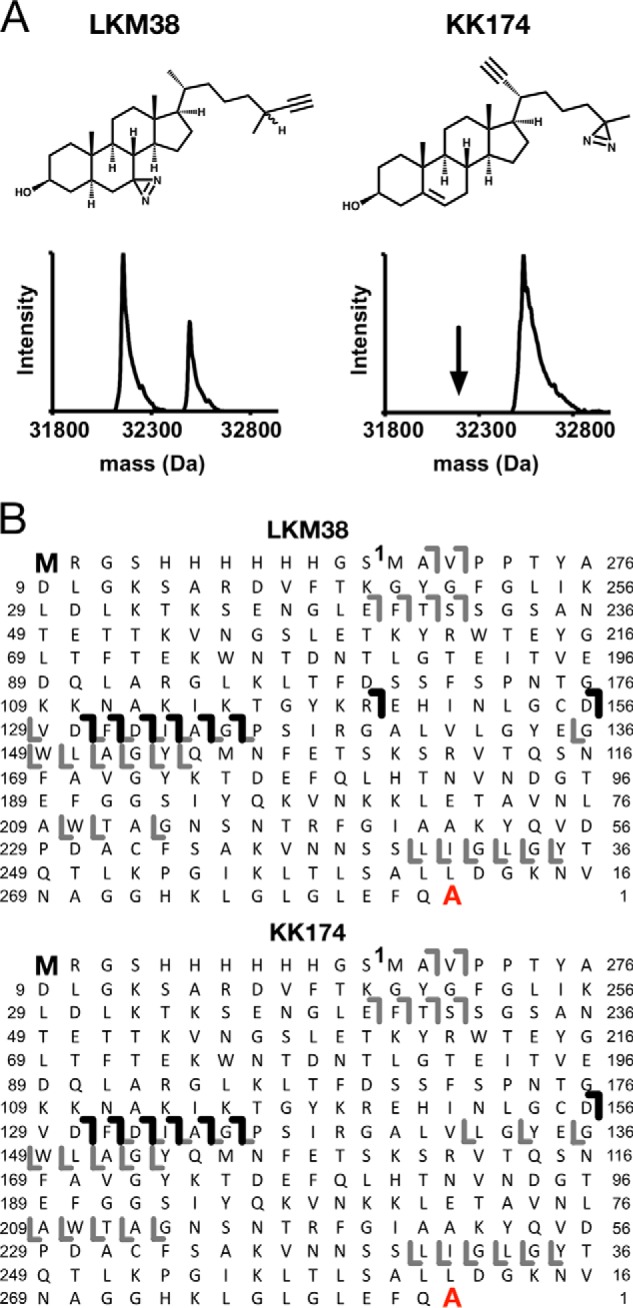
Top-down MS of mVDAC1 photolabeled with cholesterol analogues. A, chemical structures of cholesterol analogues, and associated deconvoluted spectra of mVDAC1 photolabeled with LKM38 and KK174. For LKM38, two peaks in the deconvoluted spectrum represent unlabeled and singly labeled mVDAC1 at 32,157 and 32,553 Da, respectively. For KK174, the one peak represents singly labeled mVDAC1 at 32,537 Da. B, HCD fragment ion assignments obtained by isolating the LKM38- and KK174-photolabeled species, respectively. Amino acids are numbered to exclude the first 12 residues in the N terminus that comprise the affinity tag. The gray lines represent b and y ions that do not contain a ligand adduct. The black lines represent b ions that do contain a ligand adduct and were identified by searching the fragmentation data against a database in which the ligand mass was added to the N-terminal methionine. The absence of red lines indicates an absence of y ions identified by searching against a database in which the ligand mass was added to the C-terminal alanine.