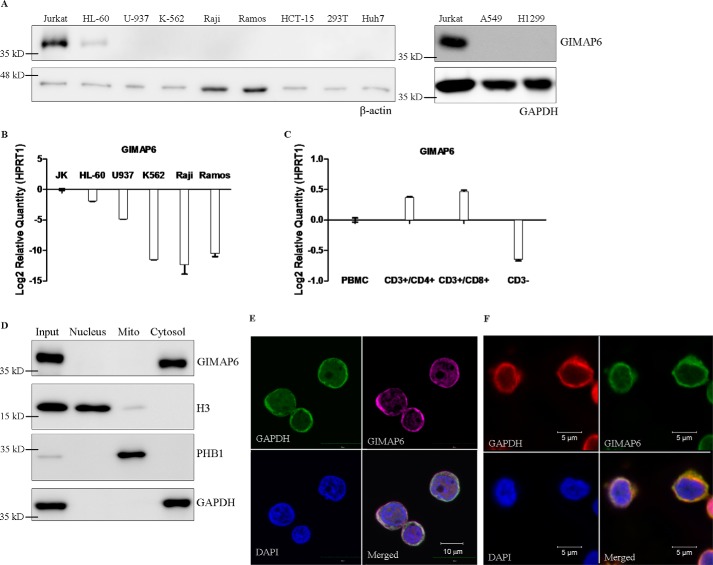
Figure 1.
GIMAP6 expression and protein distribution in T lymphocytes. A, cell lines representing the various different hematopoietic lineages, including T lymphocytes (Jurkat), promyeloblasts (HL-60), monocytes (U-937), lymphoblasts (K-562), and B lymphocytes (Raji and Ramos), as well as cell lines derived from colon (HCT-15), kidney (293T), liver (Huh-7), and lung (A549 and H1299), were analyzed for GIMAP6 protein expression by immunoblot analysis. The amount of protein loaded onto each lane was estimated by anti-β-actin or anti-GAPDH. B, GIMAP6 RNA expression levels in the hematopoietic cell lines were analyzed by quantitative PCR assay. The results were normalized against the expression level of HPRT1. Error bars indicate standard deviation. C, GIMAP6 RNA expression in three subsets of human PBMCs: CD3+/CD4+, CD3+/CD8+, and CD3− cells. These were analyzed by quantitative PCR assay. The PBMCs were obtained from a healthy donor. HPRT1 was used to normalize the dataset. Error bars indicate standard deviation. D and E, cellular distribution of endogenous GIMAP6 in Jurkat T cells. Immunoblot analysis of various protein preparations, including that of the total cell lysate (Input), revealed that endogenous GIMAP6 is restricted to the cytosolic fraction of Jurkat T lymphocyte lysates (D). E, confocal laser-scanning microscopy showed that GIMAP6 (purple, Alexa Fluor 647 goat anti-rabbit IgG) co-localized with the cytosolic marker GAPDH (green, Alexa Fluor 488 goat anti-mouse IgG). DAPI (blue) was used as a nuclear tracking dye. F, cellular distribution of endogenous GIMAP6 in primary CD3+ T cells. Primary CD3+ T cells enriched from PBMCs were used to perform immunofluorescence microscopy, which showed that GIMAP6 (green, Alexa Fluor 488 goat anti-rabbit IgG) co-localized with the cytosolic marker GAPDH (red, Alexa Fluor 594 goat anti-mouse IgG). DAPI (blue) was used as a nuclear tracking dye.

