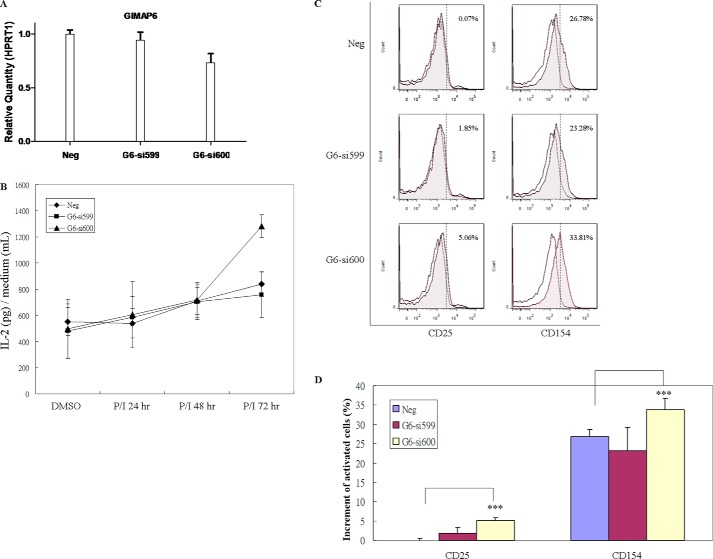
Figure 7.
Increased IL-2 secretion and CD25 and CD154 surface expression by GIMAP6 knockdown in primary CD3+ T cells after activation with PMA/ionomycin. A, GIMAP6 RNA expression in primary CD3+ T cells after transfection of siRNA; these were analyzed by quantitative PCR assay. CD3+ T cells were enriched from PBMCs, which were obtained from two healthy donors, and knockdown of GIMAP6 was performed by electroporation with either negative control (Neg) or siRNA oligonucleotides against GIMAP6 (G6-si599 and G6-si600). To monitor the efficiency of GIMAP6 knockdown, transfected cells were harvested at 48 h, and total RNA was extracted for the quantitative RT-PCR assay. HPRT1 was used to normalize the dataset. Error bars indicate standard deviation. B, the effect of GIMAP6 expression on P/I-induced IL-2 secretion. Cells were incubated with either P/I or DMSO (as a control) for 72 h. P/I indicates that the cells were treated with both PMA (10 ng/ml) and ionomycin (1 μg/ml). Media were harvested at the indicated times (24, 48, and 72 h). The data represent the average of two independent experiments with triplicate measurements (mean ± S.D.). C, the effect of GIMAP6 expression on the induction of surface antigens. Transfected primary CD3+ T cells were stimulated with either P/I or an equivalent concentration of DMSO for 72 h. Expression of CD25 and CD154 was analyzed using flow cytometry. The gray histograms show the profiles of P/I-treated cells, whereas the white histograms show those of DMSO-treated cells. The percentage in the top right corner of each panel indicates the increment of positive cells. The results were analyzed and quantified by FlowJo 7.6.1 and are shown in D. The data represent the average of two independent experiments with triplicate measurements (mean ± S.D.). ***, p < 0.001, Student's t test.

