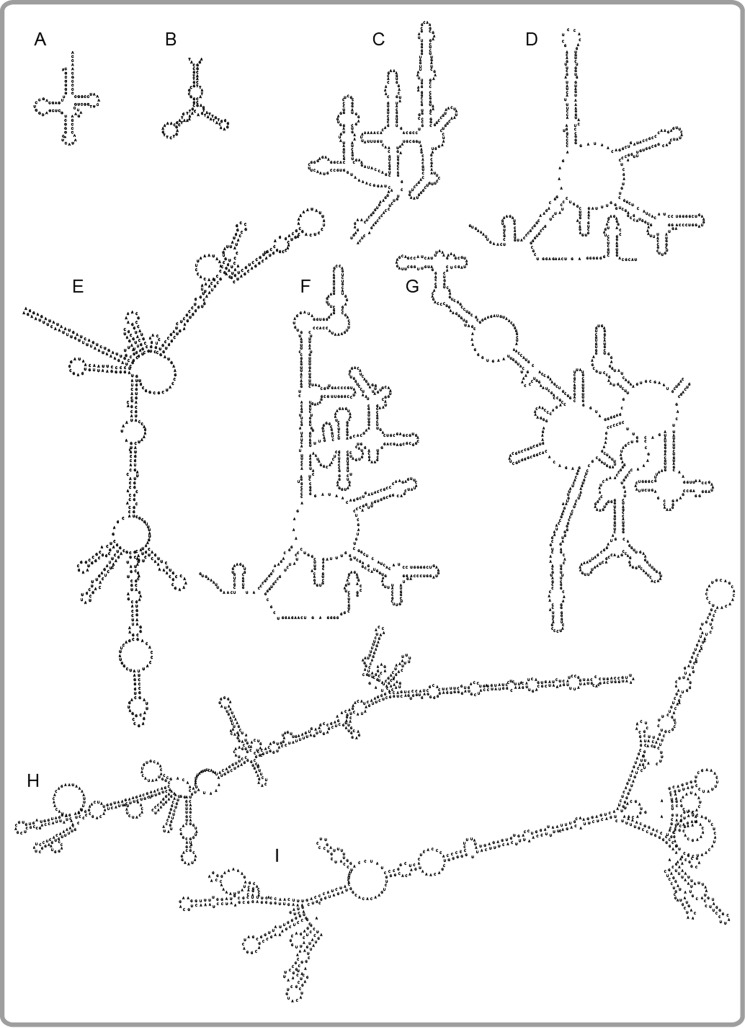
Figure 4.
Secondary structure predictions of the single-stranded RNA and DNA sequences. A, tRNA-bulk. E. coli (∼ 75 nt). B, ssDNA (82 nt). C, dom IV of E. coli 23S rRNA (361 nt). D, RNA1, central loop region of dom V of B. subtilis 23S rRNA (337 nt, the stem loop part of dom V has been replaced with an artificial, 8-nucleotides-long oligo; uppermost region) (59). E, DHFR mRNA, E. coli (516 nt). F, dom V of E. coli 23S rRNA (660 nt). G, dom II of E. coli 23S rRNA (682 nt). H, GFP+ mRNA (714 nt). I, HCA mRNA, Homo sapiens (783 nt). rRNA secondary structure maps were obtained from the rRNA secondary Structures (RibosomeGallery) database (see Ref. 70). All other secondary structure predictions were performed using the Vienna RNA Websuite (71).

