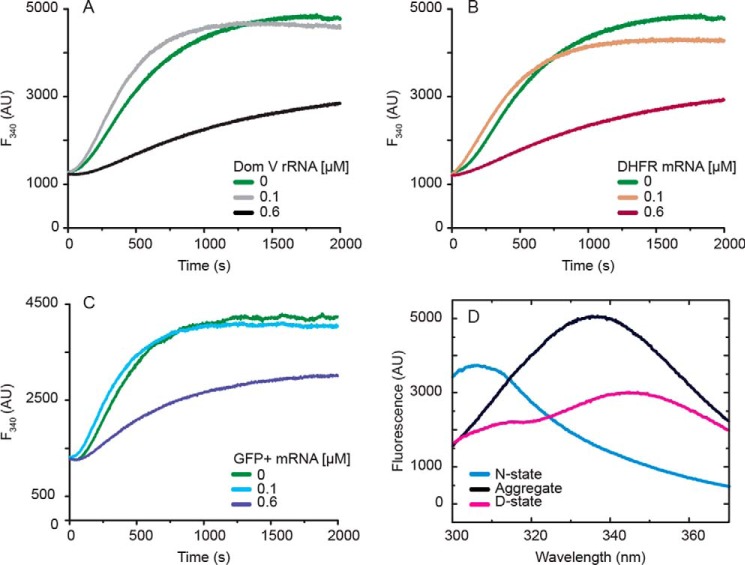
Figure 5.
p53C aggregation at 37 °C followed by intrinsic fluorescence (F340). A–C, time course of p53C (4.5 μm) aggregation in the presence of dom V rRNA (A), DHFR mRNA (B), and GFP+ mRNA (C). D, fluorescence emission spectra of native (blue), aggregated (black) and denatured (magenta) states of p53C, prepared as described under “Experimental Procedures.” The spectrum for the native state was recorded at room temperature. AU, arbitrary units.

