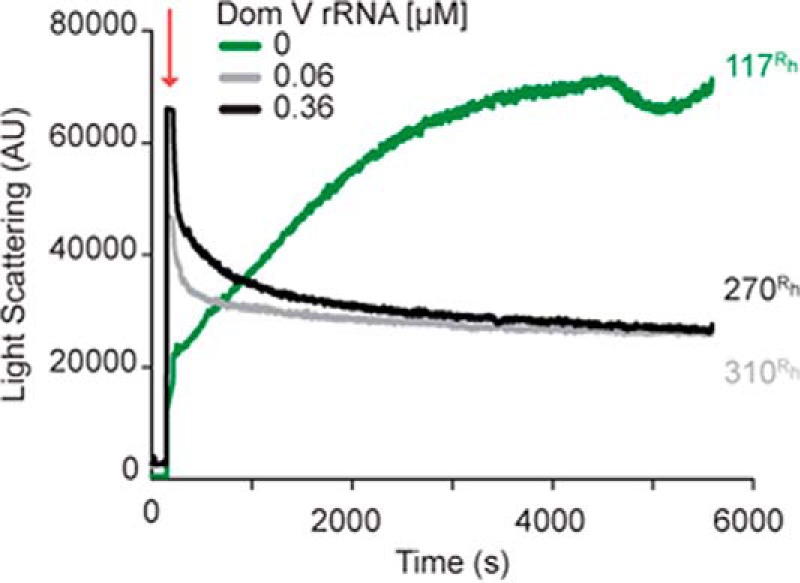
Figure 8.

Aggregation of FLp53 followed by LS at 400 nm. Time course of FLp53 (3 μm) aggregation at 37 °C with or without dom V rRNA. The numbers adhering to the end points of the plots represent the Rh (nm) as measured by DLS. The red arrow indicates protein addition to the temperature-equilibrated sample mixture. AU, arbitrary units.
