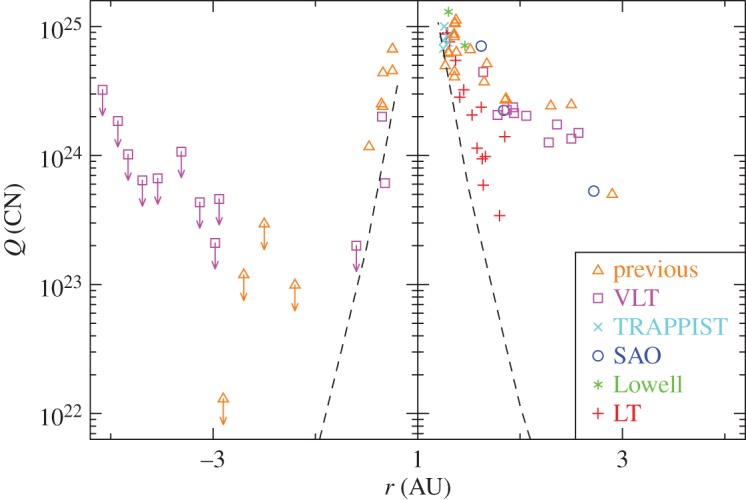
Figure 11.

CN production rate (in molecules s−1) as a function of heliocentric distance (negative values indicate pre-perihelion data, positive post-perihelion). We include data from previous orbits [3,7,12,73], narrowband photometry from TRAPPIST and the Lowell 1.1 m around perihelion, and spectroscopy from the VLT, SAO 6 m and LT (see key in plot for symbols). Error bars are not included for clarity. The dashed line shows a scaled version of the dust scaling law plotted in figure 10. In general, pre-perihelion data are only upper limits (marked with arrows) until relatively low r, when the rate climbs quickly pre-perihelion, with a similar slope to the dust fit. CN emission can be detected to larger distance post-perihelion, with a shallow decrease in Q(CN). Datasets from different telescopes mostly agree, although the LT production rates post-perihelion are generally lower than those measured with larger telescopes, but with significant scatter. This behaviour appears to be seen in data from previous orbits too, with little change in total CN production (there appears to be a reasonable match between the ‘previous’ points and those taken in this campaign). (Online version in colour.)
