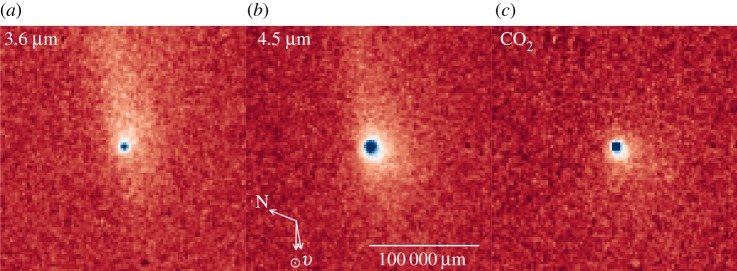
Figure 8.
Spitzer/IRAC images of the comet at 3.6 and 4.5 μm (a,b). The CO2 coma (c) is apparent after the 3.6 μm image (dust) is subtracted from the 4.5 μm image (dust and gas). Celestial North (N), the projected orbital velocity (v) and the projected direction of the Sun (⊙) are marked with arrows. Each image is approximately 200 000 km on a side. (Online version in colour.)

