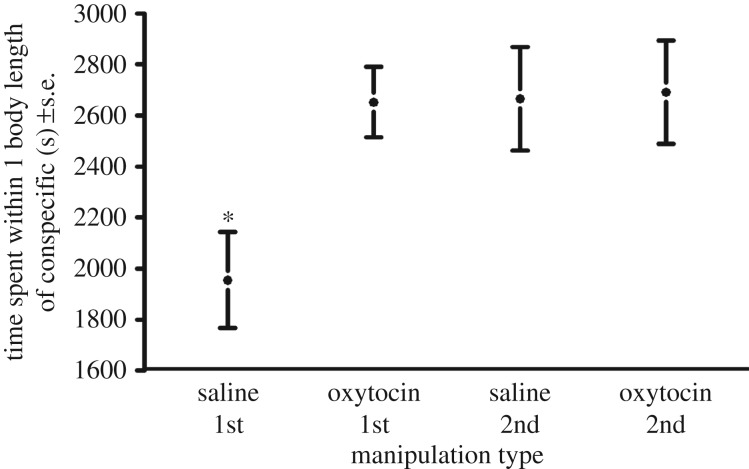
Figure 1.
The amount of time spent within one body length of the other trial individual across the initial and second meetings under oxytocin manipulation (n = 40) and saline manipulation (n = 40) with standard error (SEM) bars. Asterisks denote treatments that are significantly from others. Standard deviations for the groups were: saline 1st: 880.3, oxytocin 1st: 649.1, saline 2nd: 857.1, oxytocin 2nd: 858.0.

