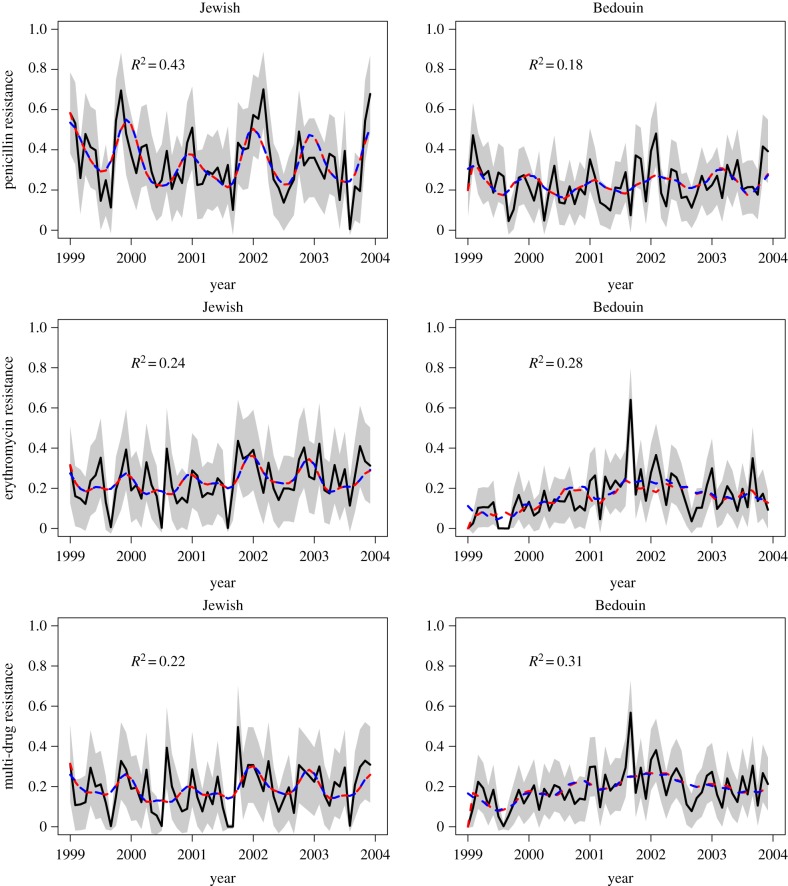
Figure 4.
Predicted frequency of resistance as a function of time, for the Jewish (left) and Bedouin (right) populations. Black lines are the data with 95% confidence intervals as a grey region; dashed red lines are the predictions from the full model (equation (2.7)) with maximum-likelihood parameters (electronic supplementary material, table S1); dashed blue lines are the predictions from the approximation (equation (2.8)) with maximum-likelihood parameters (table 1) and can hardly be distinguished from the red line.

