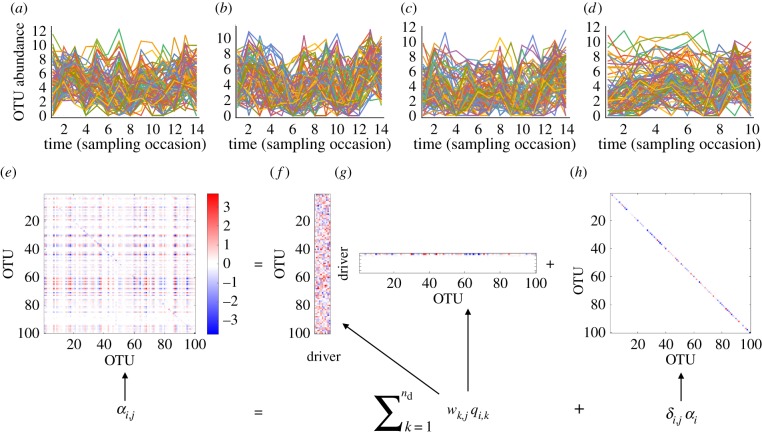
Figure 2.
Community-level drivers -model fitted to empirical data on aquatic micro-organisms. Panels (a–d) illustrate the log(x + 1)-transformed time-series data for the 100 most abundant OTUs on the four study sites. Panels (e–h) illustrate how the interaction matrix A is estimated through equation (2.4): the interaction matrix A shown in panel (e) is constructed through matrices representing the contributions of the species to the community-level drivers (wk,j, shown in panel f), the influences of the drivers to the species (qi,k, shown in panel g) and terms modelling within-species density dependence (αi, shown in panel h). While panel (e) shows the posterior mean estimate, the panels (f–h) show the posterior sample from the last Markov chain Monte Carlo round. This is because the terms wk,j and qi,k are not identifiable, as e.g. multiplying both of these by −1 leads to identical matrix A.

