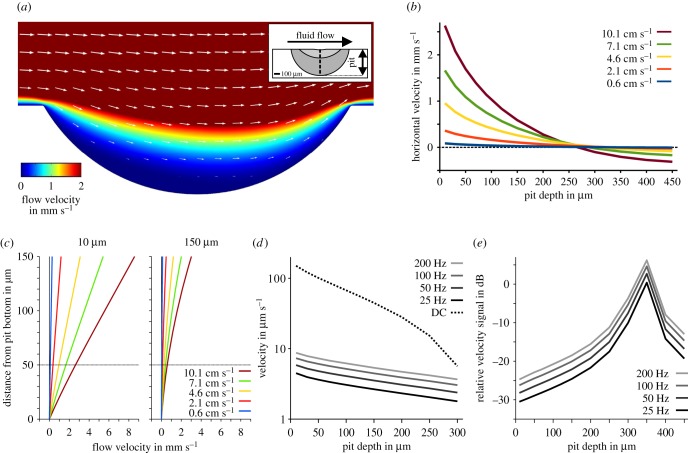
Figure 10.
Influence of epidermal pits on surface hydrodynamics of Leuciscus idus. (a) Exemplary flow field induced by a DC flow of 10 cm s−1 and a pit depth of 150 µm (velocity magnitude colour-coded, arrows pointing in the direction of flow, arrow lengths scaled logarithmically). (b) Horizontal flow velocity magnitude at 50 µm above the bottom of the pit for various pit depths and bulk flow velocities. (c) Horizontal flow velocity magnitude above the pit bottom for various bulk flow velocities used for stimulation. The two images show exemplary velocity profiles at 0–150 µm distance from the pit bottom for pit depths of 10 µm (left) and 150 µm (right). (d) Absolute flow velocity (logarithmic scaling) at a distance of 50 µm from the bottom of the pit for bulk water flow (DC, 10 mm s−1, dashed black line), sinusoidal velocity amplitudes of 0.01 mm s−1, and frequencies of 25 Hz (black line), 50 Hz (dark grey line), 100 Hz (grey line) and 200 Hz (light grey line). (e) Relative velocity amplitude of altering velocity signals of 25 Hz (black line), 50 Hz (dark grey line), 100 Hz (grey line) and 200 Hz (light grey line) as referred to the DC signal (dashed line shown in (d)).

