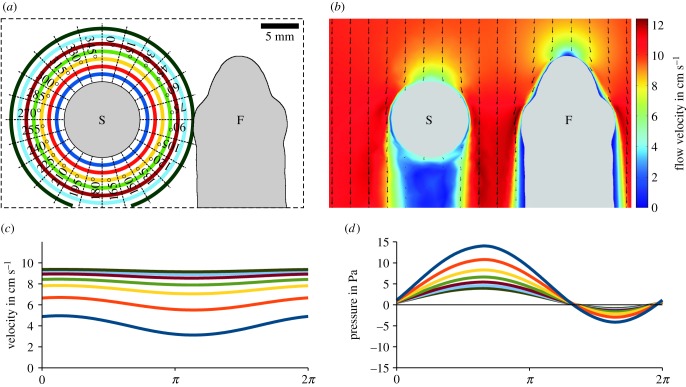
Figure 6.
Simulation of bulk water flow and pressures induced by a vibrating sphere acting on the head of Leuciscus idus. (a) Dorsal view of the experimental set-up showing the vibrating sphere and a virtual section of the fish. The coloured rings refer to distances from the sphere (1–7 mm, step size 1 mm, 24 directions in steps of 15°). (b) Changes in the flow field within the bulk water flow (10 cm s−1) induced by the vibrating sphere (amplitude ± 150 µm). Arrows show the direction of water flow, while the colour map indicates flow velocity magnitude. (c,d) Time course of the magnitude of the flow velocity (c) and pressure (d) along the main vibrational axis (0° in (a)) at distances of 1–7 mm for one cycle of sphere vibration (amplitude ± 50 µm). Note the vertical offsets of the sinusoidal signals. F, fish; S, sphere.

