Figure 8.
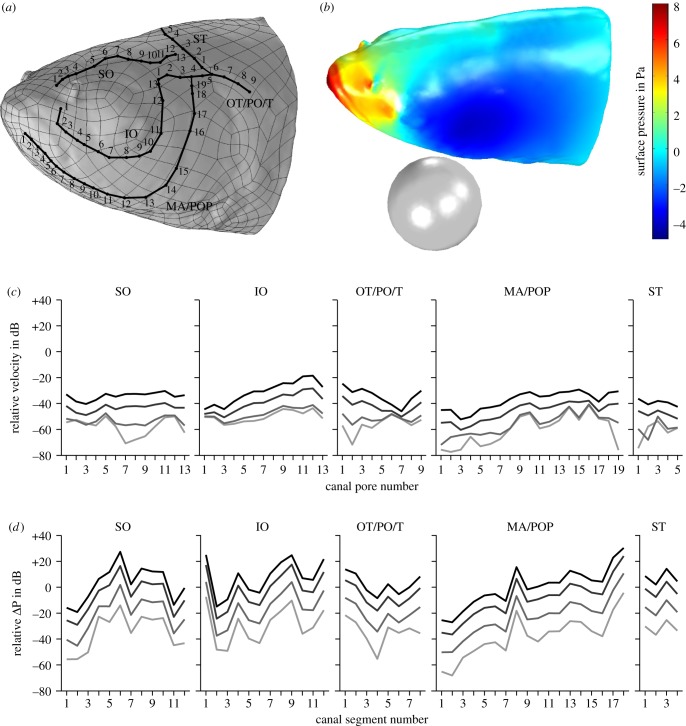
Simulation of the pressure induced by a vibrating sphere and bulk water flow (10 cm s−1) on head and canal pores of Leuciscus idus. (a) Left lateral view of the laser scanning-based model featuring vertices, cephalic lateral line canals and manually placed measuring points (numbered black dots). (b) Exemplary pressure field on the surface of the fish's head induced by a sphere vibrating parallel to the fish with an amplitude of ±150 µm in bulk water flow. (c,d) Relative flow velocity close to the fish's surface near the canal pore (c) and relative pressure gradients along canal segments (d). The location of the measuring points is provided in (a). Lines denote displacement amplitudes of ±150 µm (black), ±50 µm (dark grey), ±10 µm (grey) and ±2 µm (light grey). IO, infraorbital canal; MA, mandibular canal; OT, otic canal; PO, postotic canal; POP, preopercular canal; SO, supraorbital canal; ST, supratemporal commissure; T, temporal canal.

