
Figure 5.
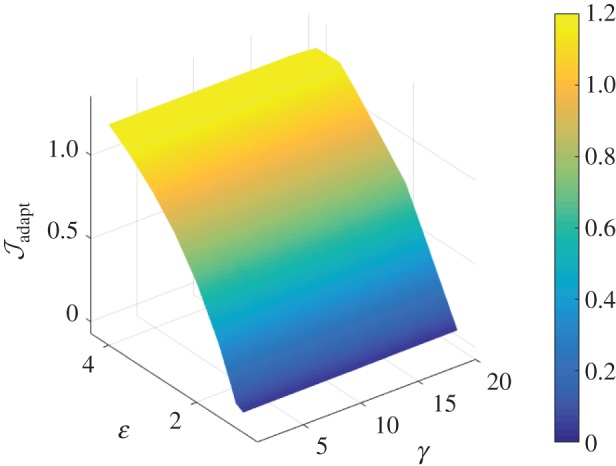
Interpolated surface plot of the cost function as a function of γ − ε loads, with a modified vasomotor evolution rate of  . The cost function (
 ) is a measure of deviation from a venous homeostatic value. Larger changes in the cost function result from perturbation to ε than to γ.