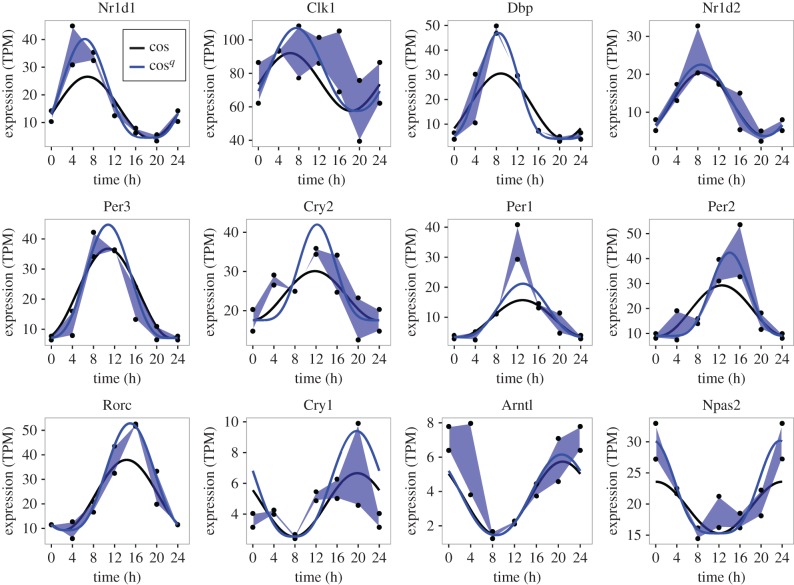
Figure 3.
A novel cosine model better fits nascent sequencing data for known clock genes. Expression of 12 established clock genes plotted as a polygons (blue shaded areas) between the maximum replicate data values across the time series and their minimum. Black symbols are data values. The solid lines are the best fit of the standard cosine model (black) and the cosineq model (blue) to the median of the replicates at each time point.

