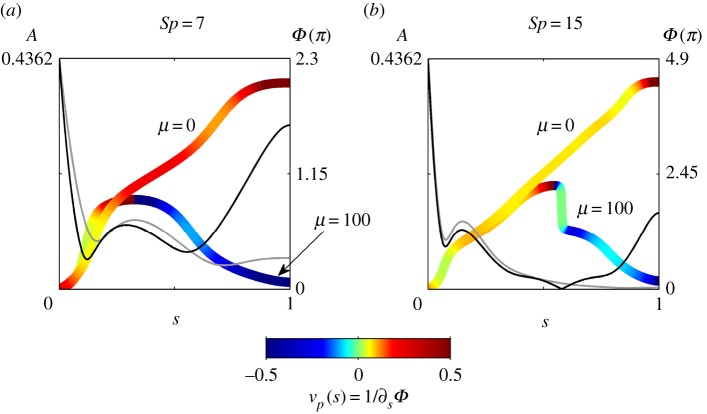
Figure 3.
The amplitude A of the solutions in the μ = 0 and μ = 100 cases are represented by the grey and black lines, respectively; the amplitude of the coloured lines indicates the values of Φ at each point along the flagella as a multiple of π, with the colour denoting the velocity. Note that all velocities below −0.5 and above 0.5 are coloured the same as each of these values, respectively. For all of the cases featured in the plot, γ = 0. (Online version in colour.)

