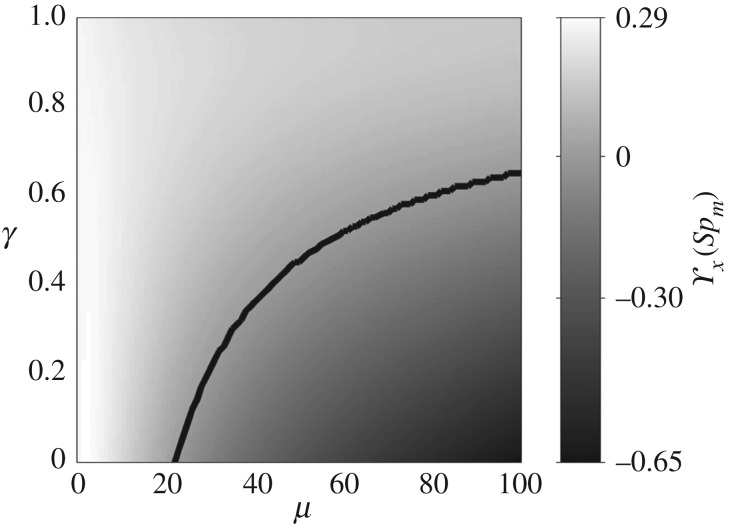
Figure 5.
Local maxima/minima ϒx(Spm), with Spm ∈ [0,5], across the parameter space (μ,γ). The black line separates the values for which ϒx(Spm) is negative from those for which it is positive. The region above (below) the black line indicates the positive maxima (negative minima) of ϒx(Spm) in (μ,γ).

