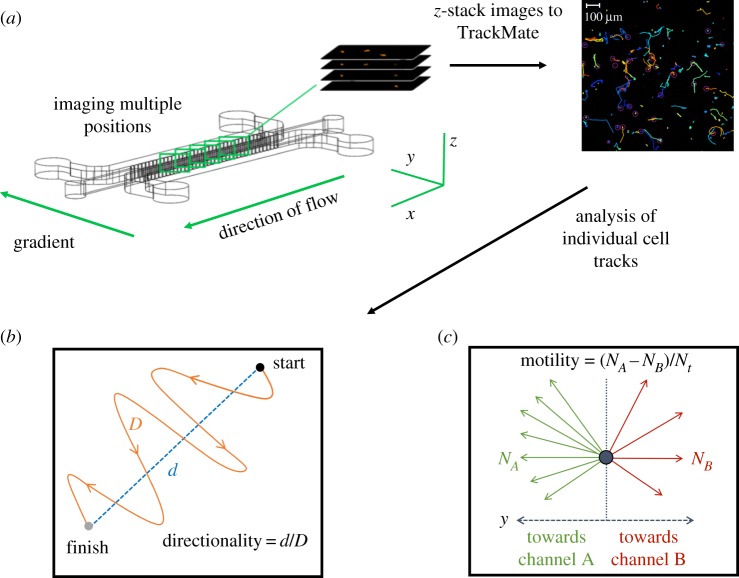
Figure 3.
Image acquisition and analysis of individual cell tracks. (a) Primary EVTs embedded in Matrigel are subjected to a chemical gradient of hrGM-CSF for 12 h. EVTs are tagged with a fluorescent cell tracker and imaged at five positions using an LSM 700 confocal microscope in the x, y and z-direction. Images are processed with TrackMate (FIJI) and converted into cells tracks and then quantified into velocity, directionality and motility. The track colours are automatically generated by TrackMate and have no significance. (b) Directionality is the ratio of the net distance a cell migrates over the total distance. (c) Motility is found by subtracting the number of cells migrating upstream towards channel A (NA) by the number of cells migrating downstream (NB) away and dividing this by the total number of cells (Nt). (Online version in colour.)

