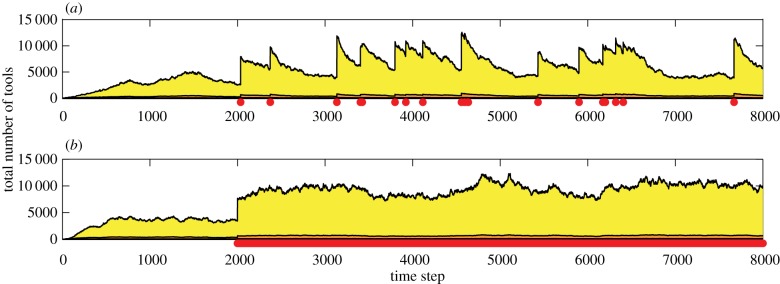
Figure 3.
The effect of frequent migration on cultural repertoire size. As in figure 2, Pmigrate = 0 for t = 0 to t = 2000; after t = 2000, Pmigrate = 0.0001 in (a) and Pmigrate = 0.4 in (b). Each panel illustrates one population's cultural trajectory. In (a), migration events are indicated by red dots on the x-axis; in (b), these events occur so frequently (more than once per time step) that the dots are individually indistinguishable. As the overall migration rate increases, the cultural repertoire does not return to the original steady state between migration events; thus, migration effectively elevates the cultural steady state of the population. Other parameters (a,b): populations = 2, N = 25, Plucky = 0.08, PcombUseful = 1, PSpontLoss = 0.08.

