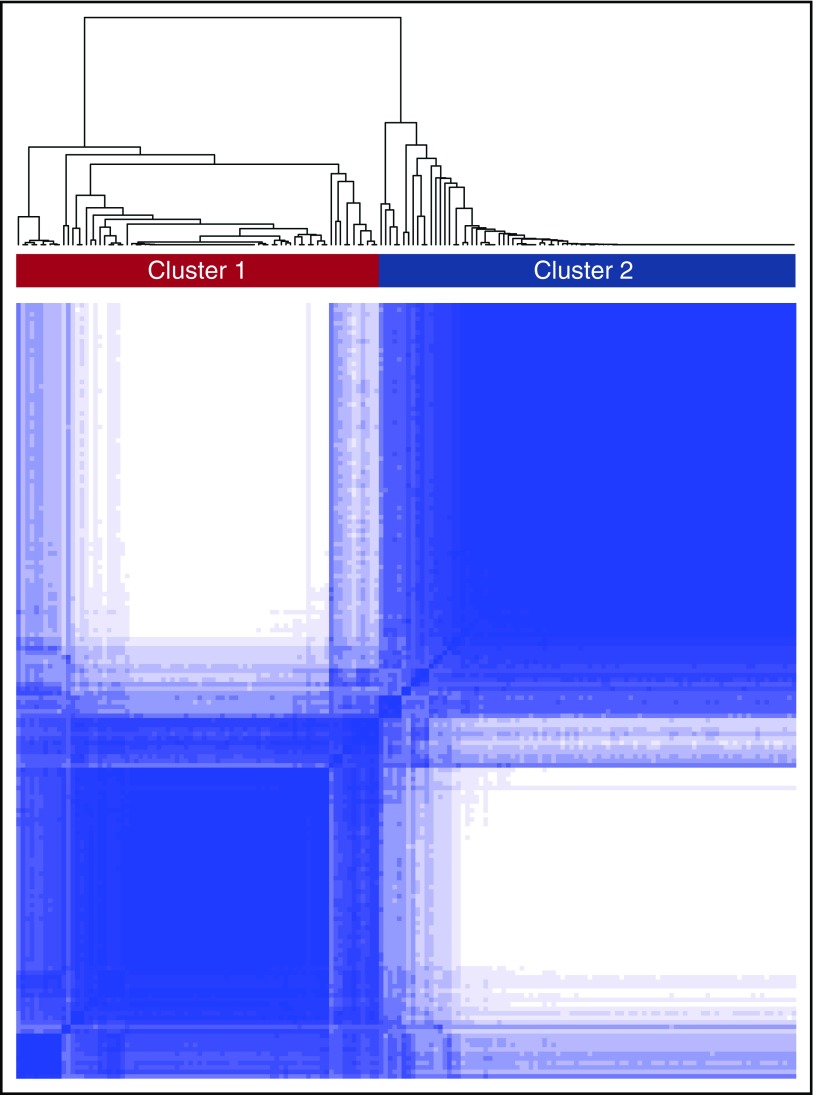
Figure 1.
Consensus clustering in SCD. The figure depicts the matrix of all consensus indices with each element in this matrix representing the index for 1 pair of samples. In an ideal matrix, all consensus indices would be 1 or 0, indicating that each pair of samples always or never, respectively, clustered together during the resampling. In the training cohort, 2 broad clusters were identified upon resampling.

