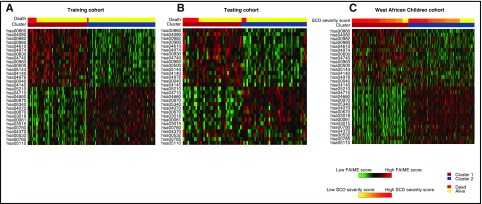
Figure 3.
Heat map depicting FAIME scores of 30 signature pathways stratified by clusters and overall survival. (A) Heat map of scores of all of the differentially regulated pathways between those who survived (yellow, top) and died (red, top) as well as those in clusters 1 (orange, top) and 2 (blue, top) within the training cohort. (B) Heat map of scores from the testing cohort. The panel depicts a heat map of scores of all of the differentially regulated pathways stratified by clusters 1 (orange, top) and 2 (blue, top). (C) SCD severity scores (yellow to red, top) within the West African Children cohort. Red and green in the panels indicate an increase or decrease in gene expression, respectively.

