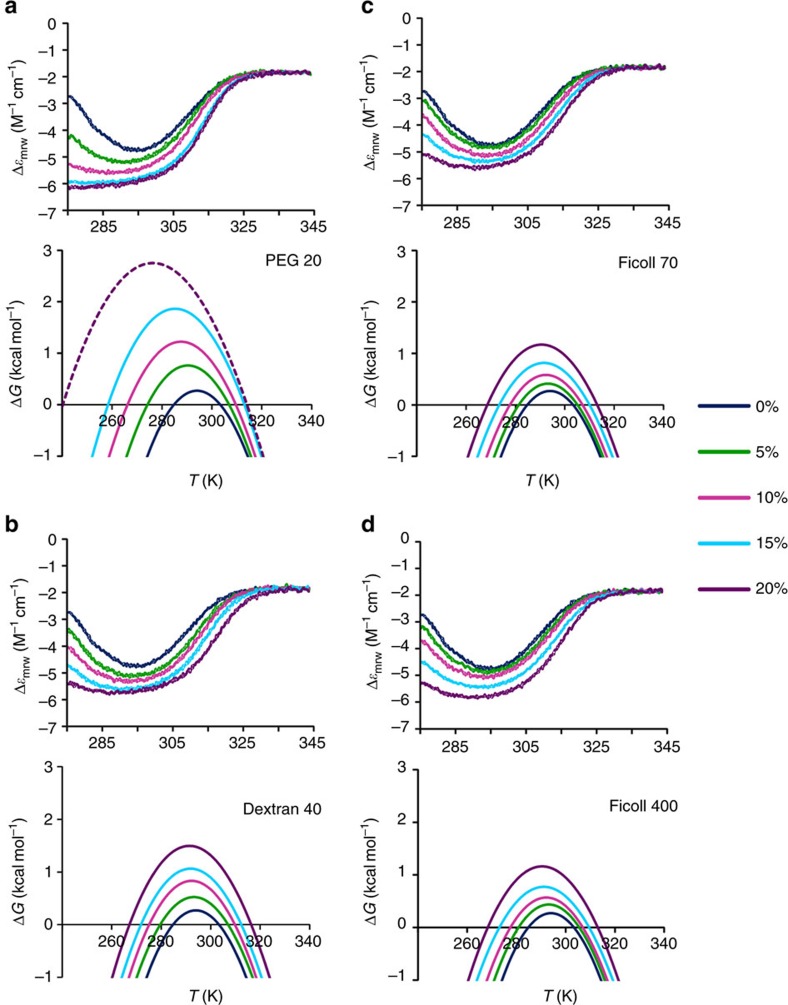
Figure 1. Thermal denaturation of Yfh1 in the presence of crowders.
Thermograms (upper panels) in the presence of increasing concentrations of crowders: (a) PEG 20, (b) dextran 40, (c) Ficoll 70 and (d) Ficoll 400. All curves were obtained starting from solutions of 10 μM Yfh1 in a 10 mM HEPES buffer at pH 7.0 by monitoring the CD intensity at 220 nm as a function of temperature in the temperature range 275 K to 343 °C in the presence of varying concentrations of crowders. Stability curves (lower panels) of Yfh1 corresponding to the thermograms (upper panels): (a) PEG 20, (b) dextran 40, (c) Ficoll 70 and (d) Ficoll 400. The curve corresponding to 20% w/v PEG 20 is represented as a dashed line because the fitting was extrapolated from those at lower concentrations; this is due to the observation that the thermogram (upper (a) panel) shows only very upward curvature at low temperatures.

