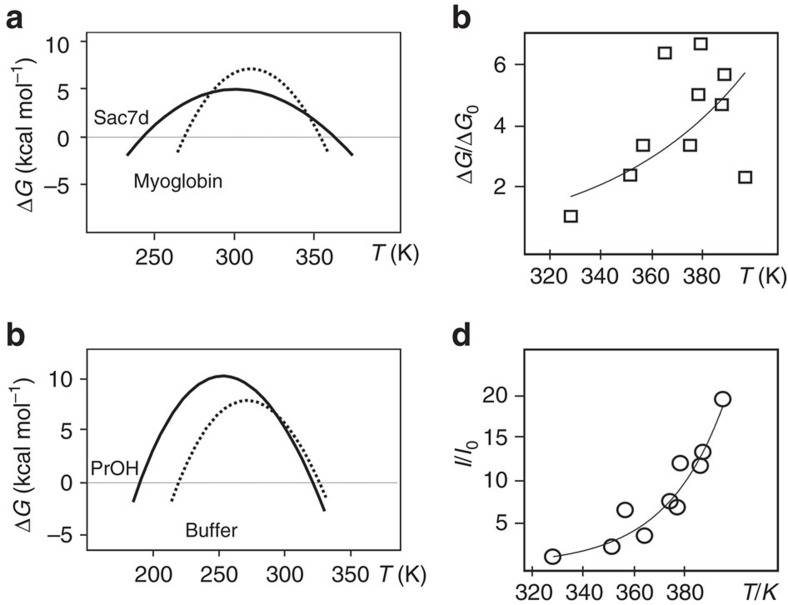
Figure 4. Applications of the integral parameter.
(a) The stability curves of Sac7d (continuous line) and Metmyoglobin (dotted line) are characterized by very different values of ΔCp. (b) The stability curves of lysozyme in glycine buffer at pH 2.0 (dotted line) and in the same buffer with the addition of 5% v/v propanol (PrOH, continuous line). The curves were calculated from the thermodynamic data reported in McCrary et al.36 and in Velicelebi and Sturtevant37 for (a,b), respectively. (c) Plot of relative values of ΔG (squares) for selected hyperthermophile proteins38. (d) Plot of the relative integrals (circles) for the same proteins of c.

