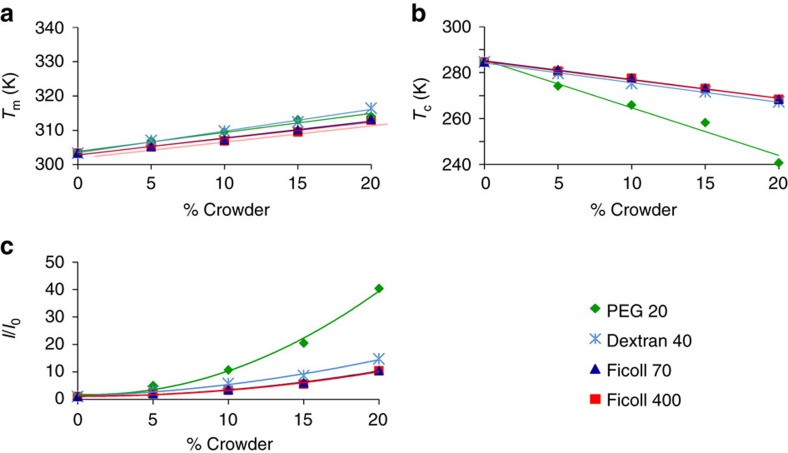
Figure 5. Concentration dependence.
(a) Variation of Tm as a function of the concentration of different crowders. (b) Variation of Tc as a function of the concentration of different crowders. (c) Variation of the normalized area under the stability curve of Yfh1 as a function of the concentration of different crowders.

