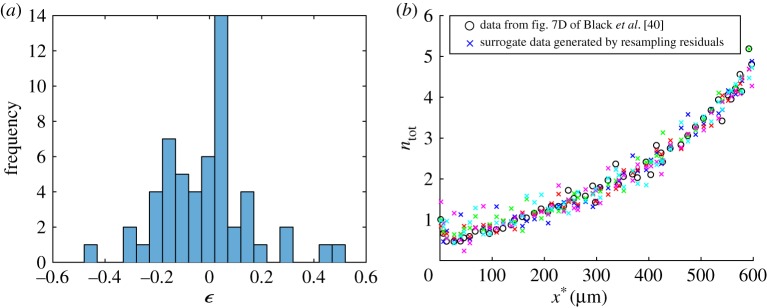
Figure 5.
(a) Histogram showing the frequency of 55 residuals which are defined by equation (2.27); the residuals show the difference between the true experimental data reported in fig. 7D of Black et al. [40] and model predictions for the total tau concentration, computed for the best-fit parameter set. (b) The actual experimental data for the total tau concentration are shown by open circles. Five randomly selected surrogate datasets (out of 5000 surrogate datasets used to produce the histograms) are shown by crosses. (Online version in colour.)

