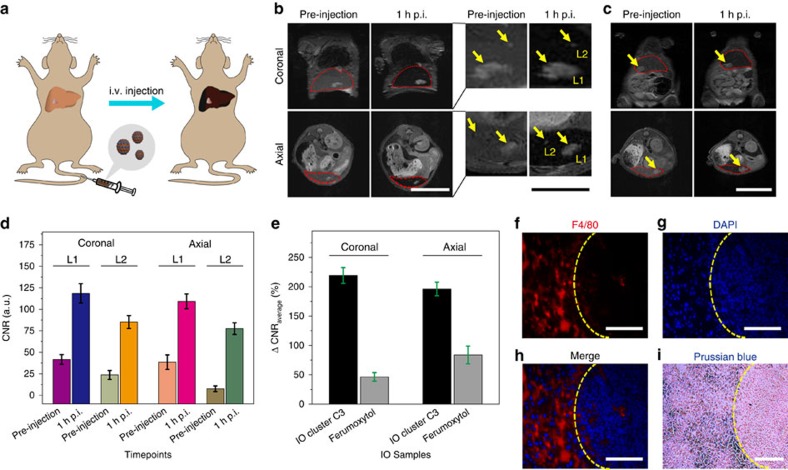
Figure 5. Contrast-enhanced MRI of mouse liver tumour.
(a) Scheme of contrast-enhanced T2-weighted MRI of an orthotopic mouse liver tumour by intravenous (i.v.) injection of contrast agents. The accumulation of contrast agents in liver tissue resolves liver tumour due to the dark pseudo-contrast found in the liver tissue but not in tumour. (b,c) Coronal and axial MR images acquired at pre-injection and 1 h post injection (p.i.) of IO cluster C3 or ferumoxytol at a region of interest (ROI) in the liver (red dotted circle), respectively. The potential lesions in the liver are indicated by yellow arrows. Scale bars, 2 cm (white), 1 cm (black). (d) Contrast-to-noise ratio (CNR) analysis of L1 and L2 calculated by fine analysis of MR images at multiple slices using Image J. Both coronal and axial images were analysed on L1 and L2 independently and triply (n=3). Mean values±s.d. (e) Quantitative analysis of ΔCNRaverage with respect to imaging liver tumour by IO cluster C3 and commercial ferumoxytol at coronal and axial planes. Mean values±s.d. (f–h) F4/80, DAPI staining and the merged images of the liver tissue, respectively. Yellow dotted curves indicate the boundary between normal liver tissue (left) and the liver tumour (right). Scale bars, 100 μm. (i) Prussian blue staining of the liver tissue indicates the decomposition of iron in normal liver tissue but not in the liver tumour. Scale bar, 100 μm.

