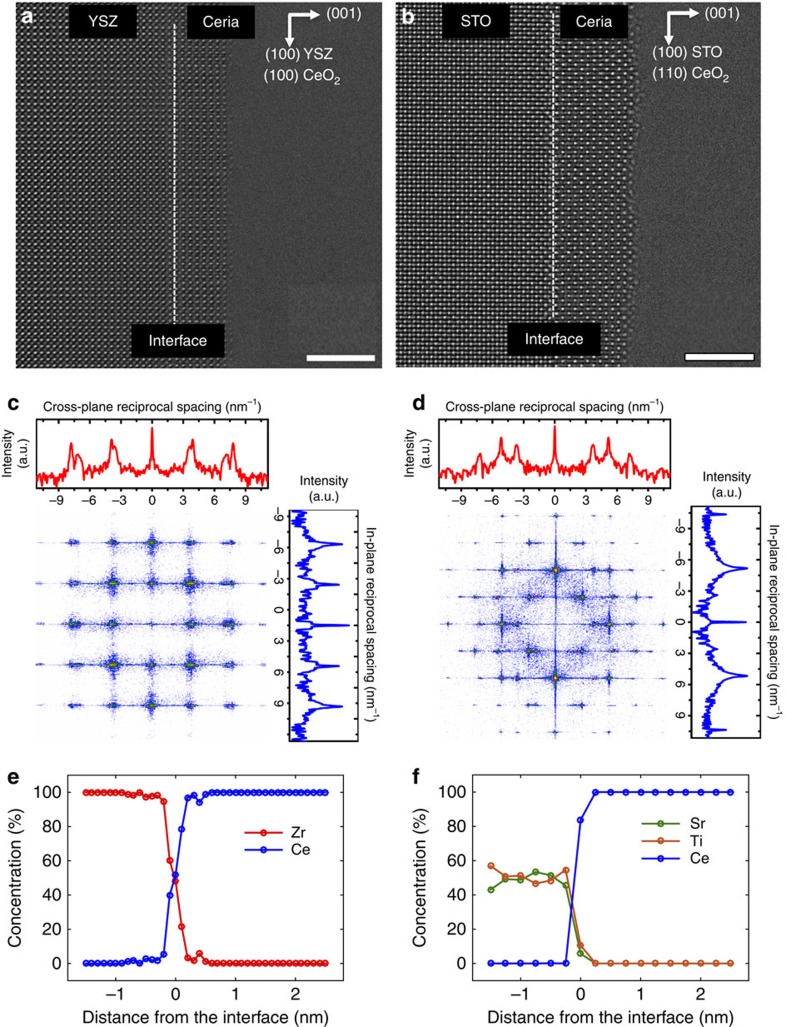
Figure 2. HR-TEM characterization of the CeO2-δ/substrate interfaces.
HR-TEM images of the (a) CeO2-δ/YSZ and (b) CeO2-δ/STO interface. Bright and dark spots correspond to cations and anions, respectively. Scale bars, 3 nm. No misfit dislocations were found at either interface, confirming that the coherently strained films of ceria were stable on both YSZ and STO even after several hours of exposure to temperatures up to 550 °C and reducing oxygen partial pressures. (c,d) The FFT patterns of CeO2-δ/YSZ and CeO2-δ/STO obtained from the corresponding TEM images. Line cuts along the in-plane direction (blue curve) show singlet peaks for both films, further confirming coherency with the substrate. Along the cross-plane direction (red curve), doublet peaks are observed, due to Poisson relaxation. Energy-dispersive spectroscopy line scan obtained in scanning TEM mode across the (e) CeO2-δ/YSZ interface and (f) CeO2-δ/STO interface of the strained, ultrathin films show no signs of significant interdiffusion of cations even after APXPS measurements at elevated temperatures. Lines are for guiding the eye.

