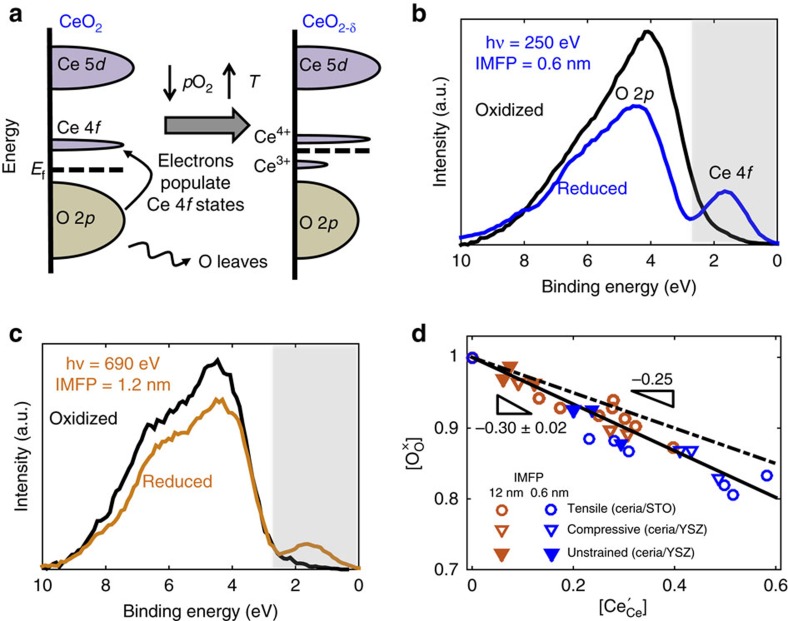
Figure 3. Valence-band spectra showing formation of Ce3+ and oxygen nonstoichiometry upon reduction.
(a) Schematic of electronic structure changes with oxygen nonstoichiometry in CeO2-δ. Upon reduction, the density of O 2p states decreases, and that of occupied Ce 4f states increase proportionally. (b) Valence-band spectra (250 eV photons, inelastic mean free path (IMFP)=0.6 nm) at 450 °C and relatively oxidizing pO2=1.3 × 10⁻⁴ atm (black curve) and reducing pO2=1 × 10⁻²⁸ atm (blue curve) showing the absence and presence of Ce 4f states, respectively. The spectra have been normalized by the integrated intensity of the corresponding Ce 4d core-level spectra. (c) Valence band spectra collected using 690 eV photons to probe the near-surface region (IMFP=1.2 nm) reveal the same qualitative behaviour. (d) A semiquantitative measure of the oxygen content, obtained from an appropriate normalization of the valence-band spectra (see Supplementary Note 2) shows an inverse correlation with Ce3+ concentration suggesting that oxygen vacancies form alongside Ce3+ at the surface and near-surface regions. Triangles and circles denote films grown on YSZ and STO, respectively. The error in  , that is, the fitted slope, is estimated by combining the fitting error (95% confidence interval) as well as the uncertainties associated with converting Ce 4f intensity to Ce oxidation state.

