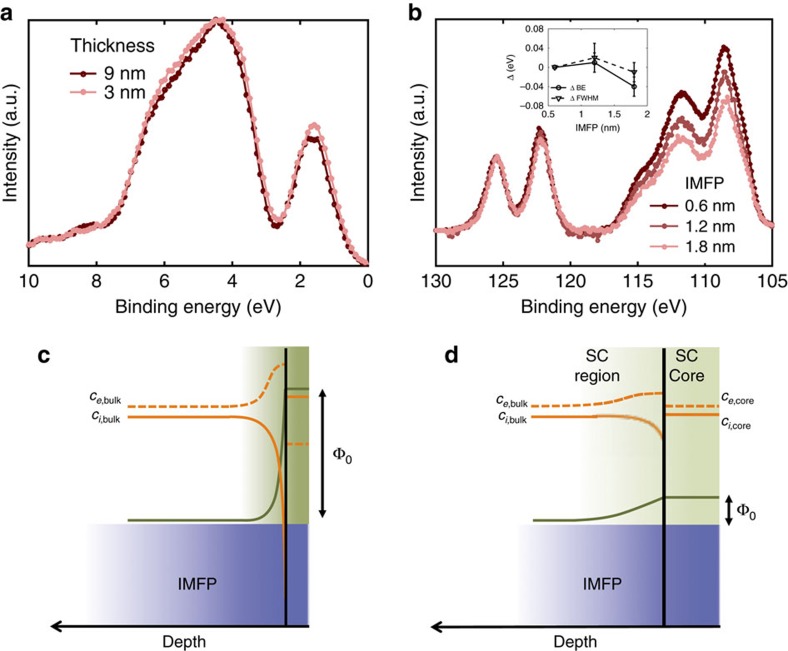
Figure 5. Probing the effect of the film/substrate interface on the reducibility of the ceria films.
(a) Comparison of the valence-band spectra of 3 and 9 nm ceria films on STO. Information depth=0.6 nm, T=550 °C, pO2=8 × 10⁻²⁶ atm. The spectra are quantitatively identical, suggesting lack of substrate induced effects on the measured oxygen nonstoichiometry. (b) Ce 4d spectra for the 3 nm CeO2-δ/STO film at information depths of 0.6 nm (hν=370 eV), 1.2 nm (hν=790 eV) and 1.8 nm (hν=990 eV) under identical conditions as in a. The spectra are normalized by the intensity of the highest binding energy peak (126 eV), such that the lower binding energy peaks are an indication of relative concentration of Ce3+. Inset shows binding energy shift of the peaks at ∼122 and ∼126 eV across the three probing depths, and the change in FWHM. Errors bars were obtained by averaging over two peaks and two samples. (c,d) Schematics illustrating the likely space-charge profiles in the information depth probed by APXPS, consistent with our experiments and simulations. Symbols are explained in the Supplementary Information. (c) XPS probes a SC layer that is significantly thinner than the inelastic mean free path (IMFP) of 0.6 and 1.2 nm, rendering the defect chemistry in the probing depth charge neutral. (d) XPS mainly probes the SC core (and a part of the SC layer) with a very weak SC potential such that deviation from charge neutrality is small.

