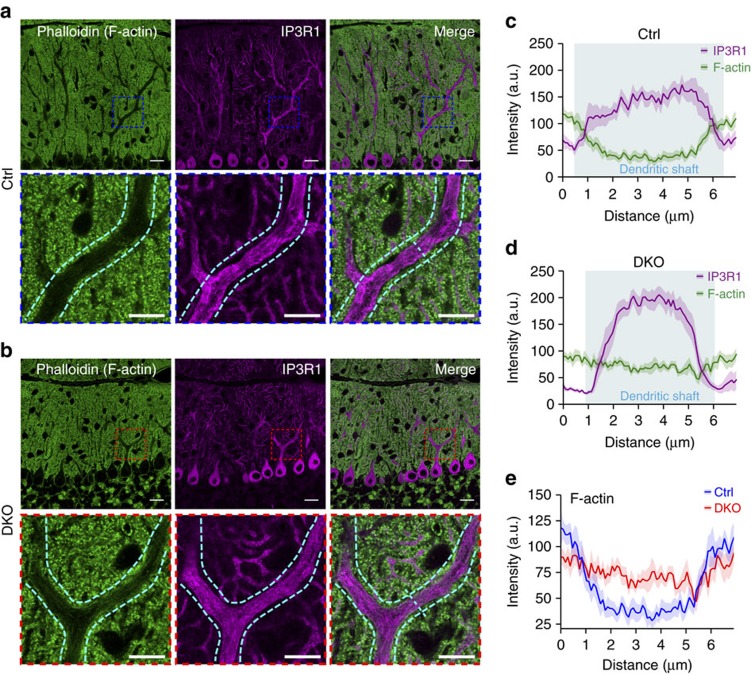
Figure 5. Distorted F-actin localization in the PCs of DKO mutants in vivo.
(a,b) Immunostaining of IP3R1 (magenta) and phalloidin staining (green) in the cerebellum sections from the controls (a) and the DKO mutants (b). Phalloidin (green) stained the F-actin cytoskeleton while IP3R1 (magenta) marked PCs. Lower panels are the zoom-in images of boxed regions respective to the upper panels. Only the central focal planes of the PC proximal dendrites are shown here. Cyan dotted curves highlight the peripheries of the dendritic shafts of the proximal dendrites. Scale bars, 20 μm; 10 μm (zoom-in). (c–e) Fluorescence intensity profile plots (across the dotted cyan lines) reveal the distribution of F-actin in the dendritic shafts of the proximal dendrites in the PCs from the controls (c) and the DKO mutants (d). Areas shaded in cyan represent the dendritic shafts. Each profile plot was sampled from 10 different PCs from 4 different mice and the curves represent mean±s.e.m. Note the altered distribution of F-actin in the centre of dendritic shafts in the PCs of the DKO mutants in vivo (e).

