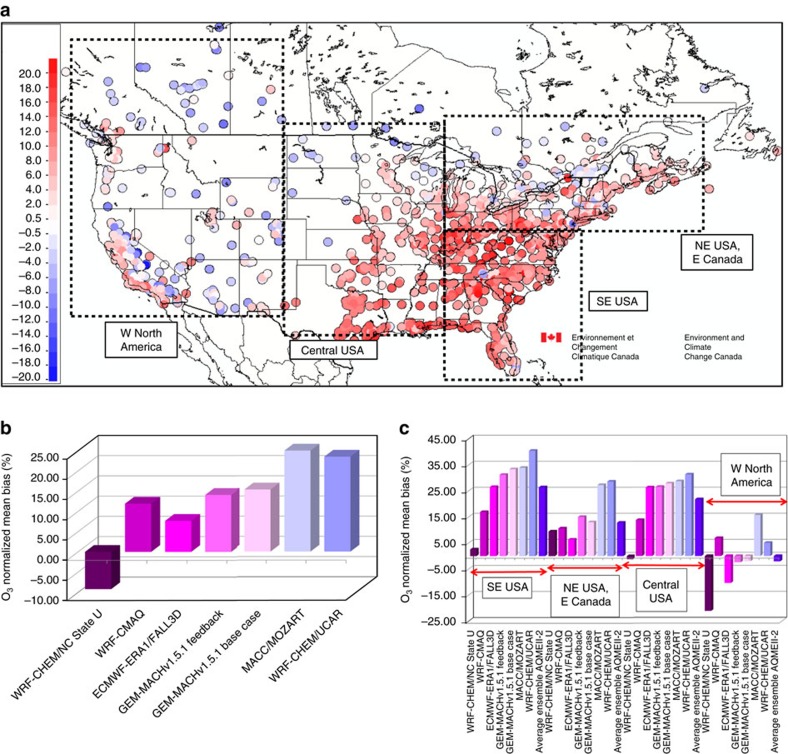
Figure 1. Typical biases in surface ozone predictions for North America.
(a) Average ozone bias at surface monitoring network observation stations, using the unmodified (base case) GEM-MACHv2.1 regional chemical transport model, for the month of July, 2010 (p.p.b.v.). Red regions indicate positive ozone biases, blue, negative ozone biases. (b) Normalized mean biases in ozone for North America for previous multiple models for July, 2010 (ref. 14) (p.p.b.v.). (c) As in b, subdivided into the regions outlined in a, along with the multi-model mean ensemble.

