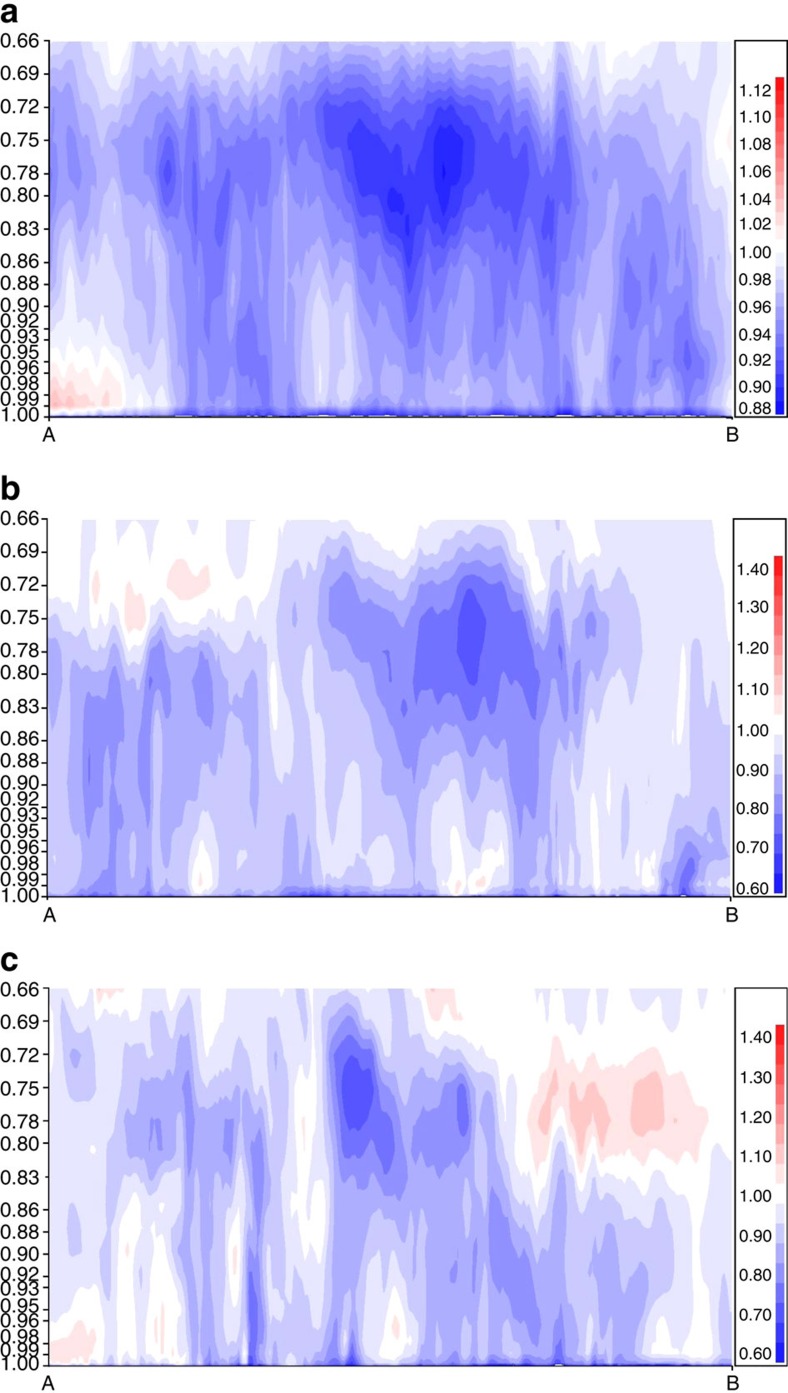
Figure 5. Canopy influence on atmospheric boundary layer ozone via canopy-to-base case mass ratio.
Eastern North-America cross-section of canopy-to-base ozone mass ratio, between the surface (hybrid level 1.0) and ∼3,450 m (hybrid level 0.66) (a) July 2010 monthly average. (b) Daily average for 4 July 2010. (c) Daily average for 27 July 2010. Vertical axis scale: hybrid coordinate (terrain following near the surface and pressure-following near the model top; a rough conversion to pressure in mb is to multiply the vertical axis values by 1,000).

