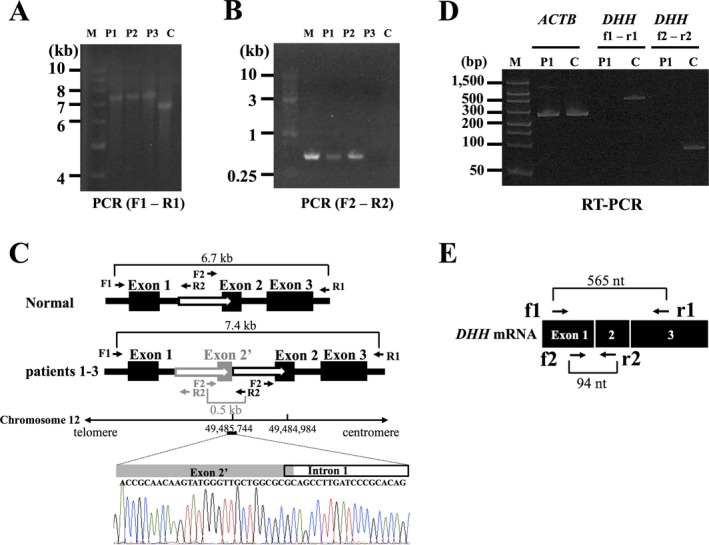
Figure 2.

(A) Long‐range PCR amplification of the whole region of DHH in the three MN patients (left). We amplified the entire DHH region including all three exons using the following primer set: F1 (5′‐GCAGCTTCCAACTGAGAAGTCA‐3′) and R1 (5′‐GCTGATATGCCCTTGTTTAGGG‐3′). DHH is approximately 700 bp longer in the three cases than in the normal control. M, size standard marker (1 kb DNA ladder); C, normal control; P1, patient 1; P2, patient 2; P3, patient 3. (B): Detection of breakpoint junction by PCR. We performed genomic PCR using the following primer set: F2 (5′‐CTACCATCGACTCAGATTCT‐3′) and R2 (5′‐GCTCCCCTCCCTCCGCCTGA‐3′). M, size standard marker (1 kb DNA ladder); C, normal control; P1, patient 1; P2, patient 2; P3, patient 3. Only the patients’ genomic DNAs carrying the duplication can be PCR amplified. (C) Structure of mutation in DHH. Direct nucleotide sequence analysis of the PCR products amplified using a primer set (F2 and R2) showed the breakpoint junctions. One of them was found in exon 2 and the other in intron 1 (chromosome 12: 49,484,984‐49,485,744). The black boxes represent exons and the white arrows duplicated regions. (D) RT‐PCR analysis of DHH mRNA expression in the sural nerves. In the RT‐PCR analyses of DHH using primers located on exons 1 and 3 (f1 and r1 in Fig 2E) and primers located on exons 1 and 2 (f2 and r2 in Fig 2E), the PCR products (565 bp and 94 bp bands) were revealed only in a control subject, confirming the absence of DHH mRNA expression in the sural nerve of the patient 1. RT‐PCR of ACTB revealed bands corresponding to 285 bp in both the patient 1 and a control subject. M, size standard marker (FlashGel DNA marker); C, normal control; P1, patient 1; ACTB, actin beta. (E) A schematic presentation of normal DHH mRNA along with primers used in the RT‐PCR analysis.
