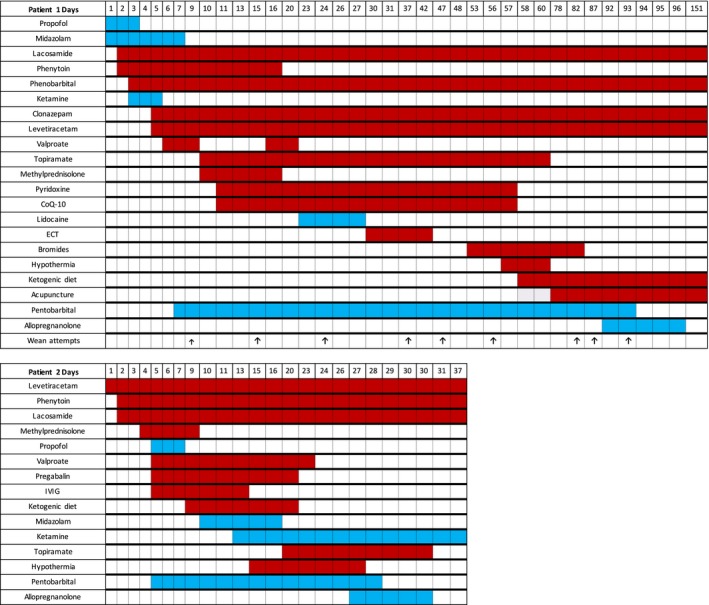
Figure 1.

Graphical representation of most significant interventions during hospitalization. The color shadings correspond to the days of exposure. The blue shading represents continuous infusion and the red shading represents interval dosing. Arrows signify formal wean initiations.
