
Figure 1.
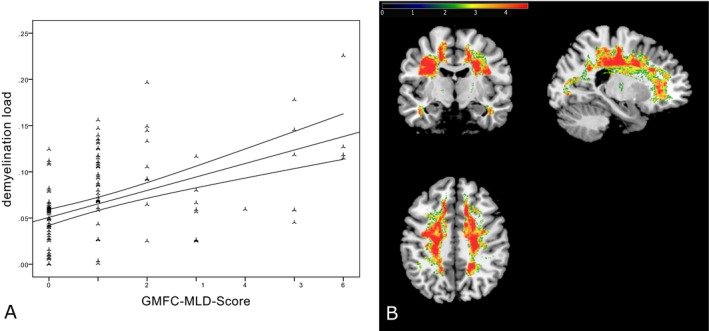
Correlation between GMFC‐MLD score and demyelination load. (A) The positive correlation between the corrected demyelination load and gross motor function loss, indicated by higher GMFC‐MLD scores (ρ = 0.55, P < 0.0001). (B) The spatial association between demyelination of white matter (WM) in the central region and gross motor deterioration (higher GMFC‐MLD scores). For illustration, significance thresholds of 5% false discovery rate correction24, 34 are displayed. The color bar represents z scores.