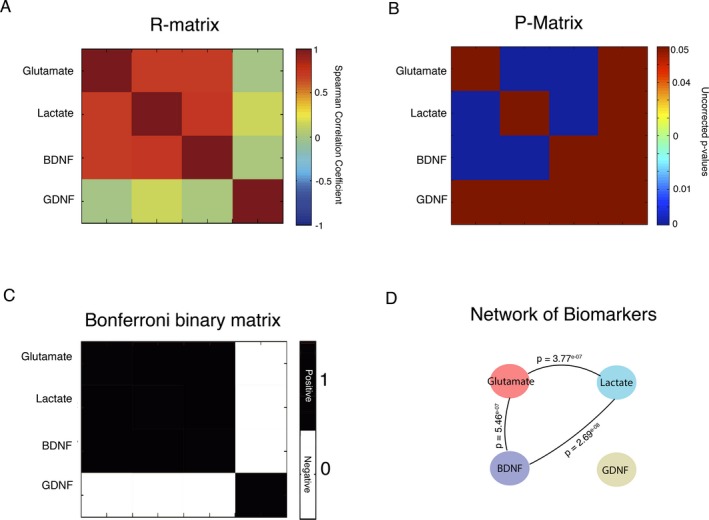
Figure 4.

Association between biomarkers indexed by cross‐correlation analyses. (A) Symmetric matrix of correlation coefficient values between biomarkers; (B) Symmetric matrix of – values between biomarkers; (C) Binary matrix corrected by Bonferroni method at P < 0.05; (D) Network for the biomarkers indicating high levels of associations between glutamate, lactate and BDNF.
