Figure 5.
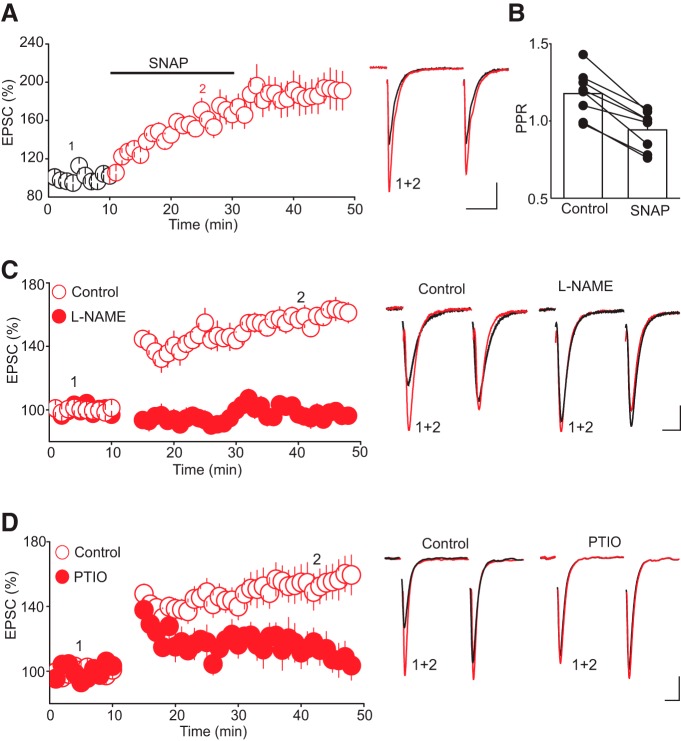
Nitric oxide signaling mediates tLTP. A, The nitric oxide donor SNAP increases AMPAR-EPSC amplitude by enhancing glutamate release. Left panel illustrates summary graph of the effect of SNAP (200 µM, n = 8) on the amplitude of AMPAR-EPSCs. Middle panel illustrates superimposed average pairs of EPSC traces collected before and during SNAP application. B, Summary histogram of changes in PPR of AMPAR-EPSCs obtained in control and in the presence of SNAP. Note that SNAP (200 µM) significantly (*, p < 0.05, n = 8) reduced the PPR. C, Nitric oxide synthase inhibitor L-NAME abolishes tLTP. Left graph illustrates summary graph of tLTP obtained in control condition (O, n = 14) and in slices pretreated with L-NAME (100 µM, •, n = 14). Right panel represents sample average AMPAR-EPSC traces taken during the experiment as depicted by numbers in the left graph. D, The NO scavenger PTIO prevents tLTP. Left panel illustrates the time course and magnitude of tLTP obtained in control (O, n = 8) and in the presence of NO scavenger PTIO (100 µM, •, n = 8). Left graph is superimposed AMPAR-EPSC traces taken during the course of experiment as indicated by number in the left graph. Scale bars: 25 pA, 10 ms.

