Figure 6.
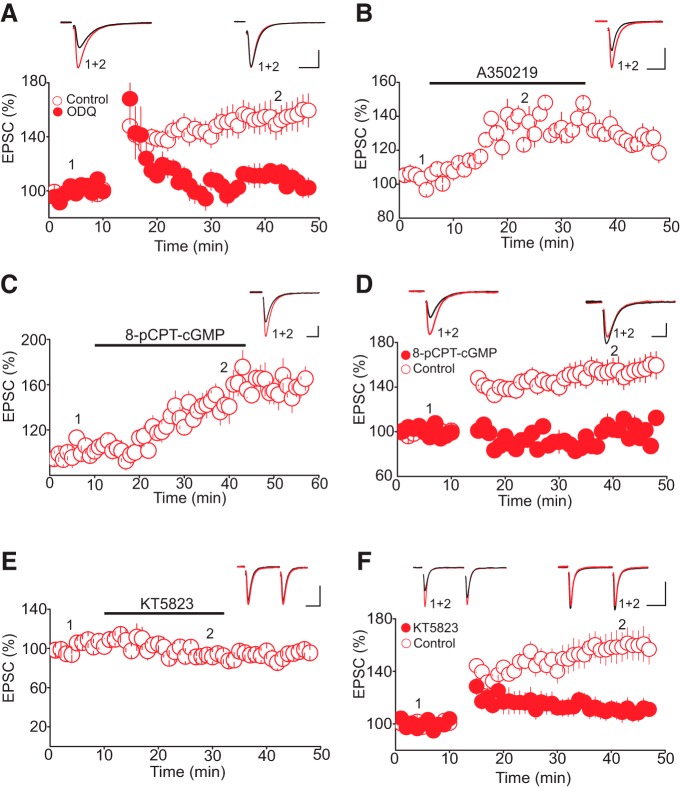
Activation of cGMP-PKG pathway mediates tLTP. A, Inhibition of sGC blocks tLTP. Lower graph is a summary of tLTP obtained in control condition (O, n = 10) and in slices treated with the sGC inhibitor ODQ (100 µM, •, n = 10). Upper graph illustrates superimposed AMPAR-EPSC traces taken before and during tLTP as indicated by numbers in lower graph. B, Activation of sGC mimics tLTP. Lower panel depict a summary of the potentiation of AMPAR-EPSC induced by the selective sGC activator A350219 (100 µM, n = 7). Upper graph is superimposed AMPAR-EPSC traces taken before and during A350219 administration. C, The membrane permeable cGMP analog 8-pCPT-cGMP mimics tLTP. Lower graph illustrates the averaged potentiation of AMPAR-EPSCs induced by 8-pCPT-cGMP (100 µM, n = 7). Upper graph is superimposed traces of AMPAR-EPSCs taken before and during administration of 8-pCPT-cGMP. D, The membrane permeable cGMP analog 8-pCPT-cGMP occludes tLTP. Lower panel is a summary graph of the tLTP obtained in control condition (O, n = 8) and in the presence of 8-pCPT-cGMP (100 µM, •, n = 8). Upper graph depicts AMPAR-EPSCs traces taken at the time points indicated by numbers in lower graph. E, Inhibition of PKG does not alter the baseline amplitude of AMPAR-EPSCs. Lower panel is a summary graph of the effect of KY5823 (1 µM, n = 6) on the amplitude of AMPAR-EPSCs. Upper graph illustrates sample AMPAR-EPSC traces taken during the course of the experiments as indicated by numbers in the lower panel. F, Inhibition of PKG abolishes tLTP. Lower panel illustrates a summary of tLTP obtained in control (O, n = 8) and in slices treated with the PKG inhibitor KT5823 (1 µM, •, n = 5). Scale bars: 50 pA, 20 ms.

