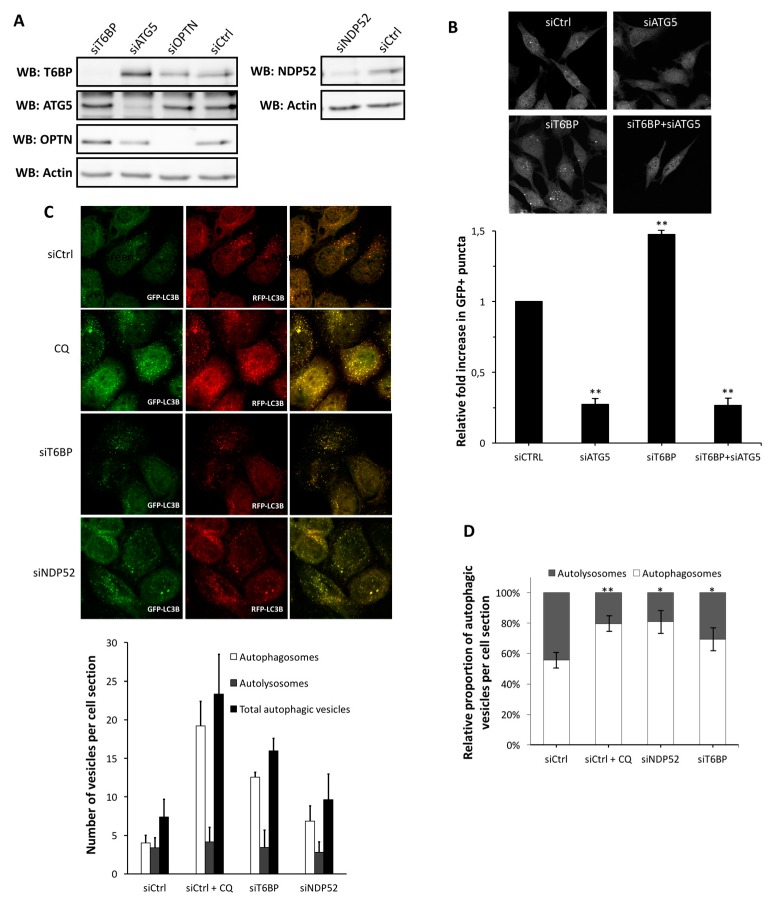
Figure 1.
T6BP function in autophagosome maturation. (A) HeLa cells transfected with the indicated short interfering RNAs (siRNAs) for 48 h, were lysed, and the expression of relevant proteins was probed by Western blotting; (B) GFP-LC3 HeLa cells were transfected or co-transfected with the indicated siRNAs for 48 h and fixed for analysis by confocal microscopy. Representative profiles are shown along with a graph expressing the relative fold induction of the dot number compared with control cells; (C) mRFP-GFP-LC3 HeLa cells were transfected with the indicated siRNAs for 48 h and were treated or not treated during the last 2 h of culture with chloroquine. Representative profiles of autophagosomes (RFP+GFP+ dots) and autolysosomes (RFP+GFP− dots) per cell section assessed by confocal microscopy are shown and were quantified. Results are expressed as absolute numbers of individual vesicles (total autophagic vesicles = all RFP+ dots); (D) Results in (C) are shown as the percentage of total autophagic vesicles; (B,C) were each carried out three times in duplicates. GFP: green fluorescent protein; RFP: red fluorescent protein; WB: Western blot; Ctrl: control; CQ: chloroquine.

