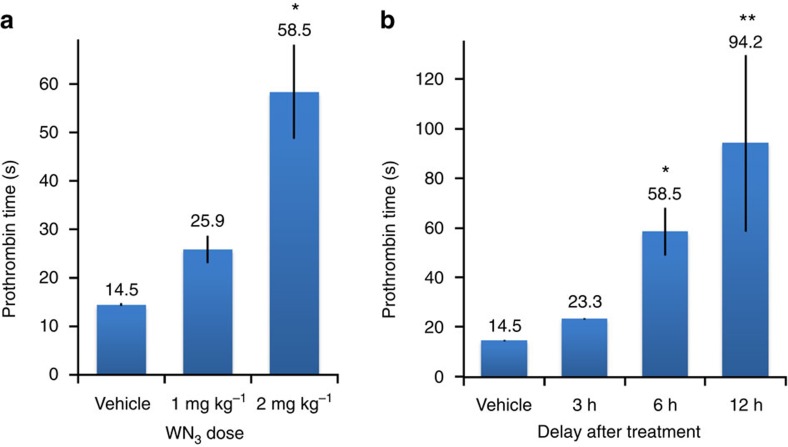
Figure 3. In vivo biological activity of WN>3 (2) analogue.
(a) PT depends from the WN3 2 dose delivered by IP injection. Dose/response curve of WN3 2 was measured 6 h after the second injection of 1 and 2 mg kg−1 of WN3 2 and compared to vehicle-treated mice (two IP injections, n=4). (b) PT depends on the delay after treatment. WN3 2 (2 mg kg−1) was administered twice with a 24-h interval by IP injection and PT was measured 3, 6 and 12 h (n=4–6/group) after the second treatment and compared to vehicle-treated mice. Statistical differences identified with protected least significant difference (PLSD) Fischer test were indicated as: *P<0.05, **P<0.01 as compared with vehicle-treated mice. Error bars indicate s.e.m. values.

