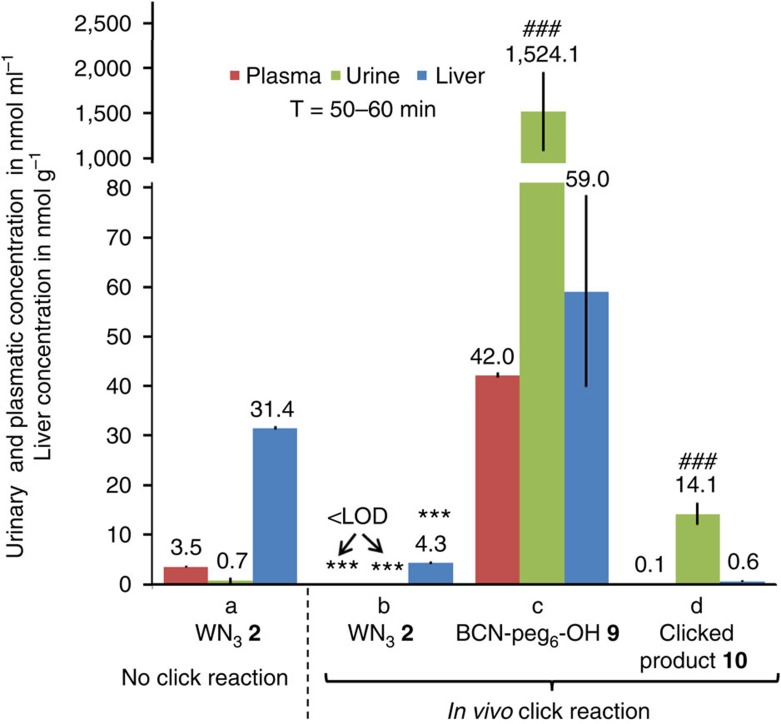
Figure 7. Effects of in vivo click reaction on WN3 (2) distribution and renal excretion.
(a) WN3 2 concentration was measured in the plasma, urine and liver of mice treated with a single dose of WN3 2 (2.0 mg kg−1, 5.7 μmol kg−1, 1 eq) by IP injection (n=3). (b–d) Analyses of free and clicked WN3 2 and BCN-peg6-OH 9 after single IP injection of WN3 2 (2.0 mg kg−1, 5.7 μmol kg−1, 1 eq) followed 5 min later by SC injections of BCN-peg6-OH 9 (52 mg kg−1, 114.4 μmol kg−1, 20 eq) (n=3). (a–d) Samples collection have been performed 50–60 min after the last injection. Note that plasma (red) and urine (blue) concentrations of all substrates were reported in nmol ml−1 whereas liver (green) levels were shown in nmol g−1. <LOD (limit of detection), below the detection limit. ***P<0.001 as compared to WN3 2 in respective compartments shown in ‘No click reaction' panel. ###P<0.001 as compared to liver and plasma measures of the corresponding compound. Error bars indicate s.e.m.

