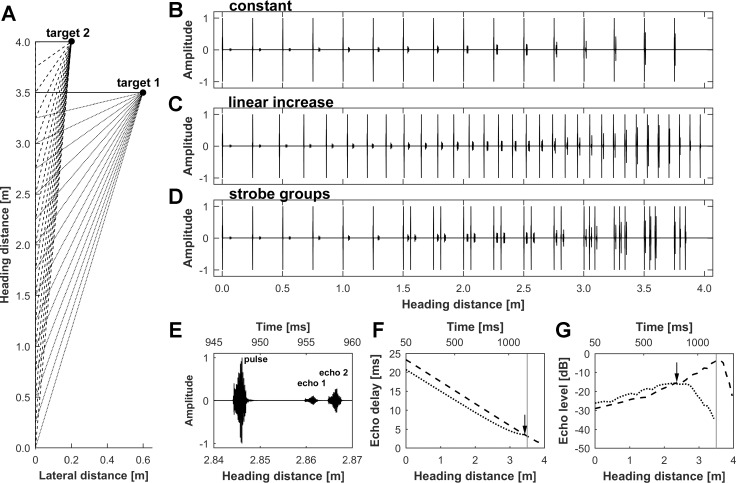
Fig. 1.
Generation of naturalistic pulse/echo sequences. A: spatial layout of the virtual flight sequence with 2 targets positioned at heading distances of 3.5 and 4.0 m and at lateral distances of 0.6 and 0.2 m, respectively. Dotted (target 1) and dashed lines (target 2) indicate the reflected echoes from the objects during the flight sequence. B–D: sequences of pulses and echoes from both targets are shown for a constant pulse rate (B), a linearly increasing pulse rate (C), and strobe groups (D). E: details of a pulse/echo sequence showing a single echolocation pulse and corresponding echoes from target 1 and target 2. F and G: progression of echo delay (F) and echo level (G) for target 1 (dotted line) and target 2 (dashed line) along the flight path with corresponding timescale. The acoustic stimulation is preceded by a 50-ms silent period to determine the level of spontaneous activity and is followed by another 200-ms silent period. Vertical gray lines mark the position where the bat passes target 1. F: the echo delay of target 2 exceeds the echo delay of target 1 until the 3.43-m heading distance (black arrow; 7 cm before passing target 1). G: the echo levels for target 1 and target 2 increase when the bat approaches the targets. After an ~2.4-m heading distance, the angle to target 1 increases considerably, and consequently, the target 1 echo level drops rapidly as target 1 leaves the beam of sonar emission.

