Fig. 3.
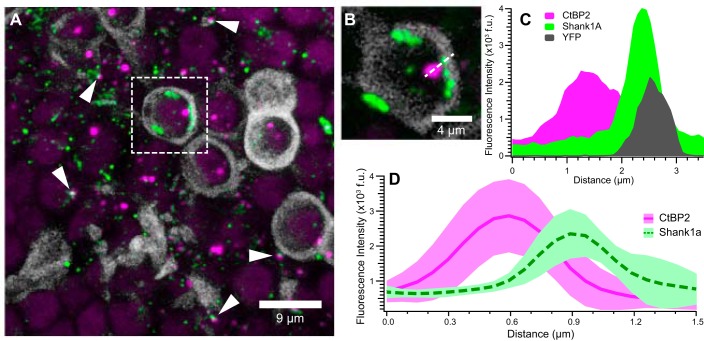
Cellular localization of CtBP2- and Shank1a-positive puncta. These micrographs illustrate closely apposed CtBP2- (red) and Shank1a-positive (green) puncta and provide evidence of their cellular localization in utricles from thy-1/YFP mice (Feng et al. 2000). YFP-positive afferent calyces aid in illustrating the spatial localization of synapse markers. A: maximum-intensity projection micrograph showing several YFP-positive calyces (grayscale) that encapsulate CtBP2-positive puncta. Additional closely apposed CtBP2- and Shank1a-positive puncta, ostensibly associated with type II hair cells, are readily observed (examples highlighted by white arrowheads). One representative YFP-positive calyx with puncta is isolated (dashed white box) for closer inspection in B and C. B: high-magnification micrograph (single optical section) of the YFP-positive calyx shown in A. Shank1a-positive puncta are observed to be spatially close to the calyx, whereas the CtBP2-positive punctum is within the calyx. The dashed white line drawn through the CtBP2 and Shank1a puncta, as well as the calyx, illustrates the dimension of the fluorescence intensity profile shown in C. C: fluorescence intensity profile from image in B, illustrating the overlapping emission from the Shank1a and YFP, whereas CtBP2 exhibits greater spatial segregation. Fluorescence intensity was obtained from a single optical section with 12-bit intensity range and is expressed in fluorescence units (f.u.) These data further support the notion that Shank1a immunolabeling (green) is closely associated with the postsynaptic calyx (grayscale). D: mean intensity profiles (f.u.) for 12 CtBP2 (red solid line) and Shank1a (green dashed line) puncta pairs. The respective red- and green-shaded regions reflect the standard deviation of fluorescence intensity profiles. For this analysis, fluorescence intensity profiles from 6 synapses each from 2 image stacks were measured and aligned on the peak CtBP2 intensity.

